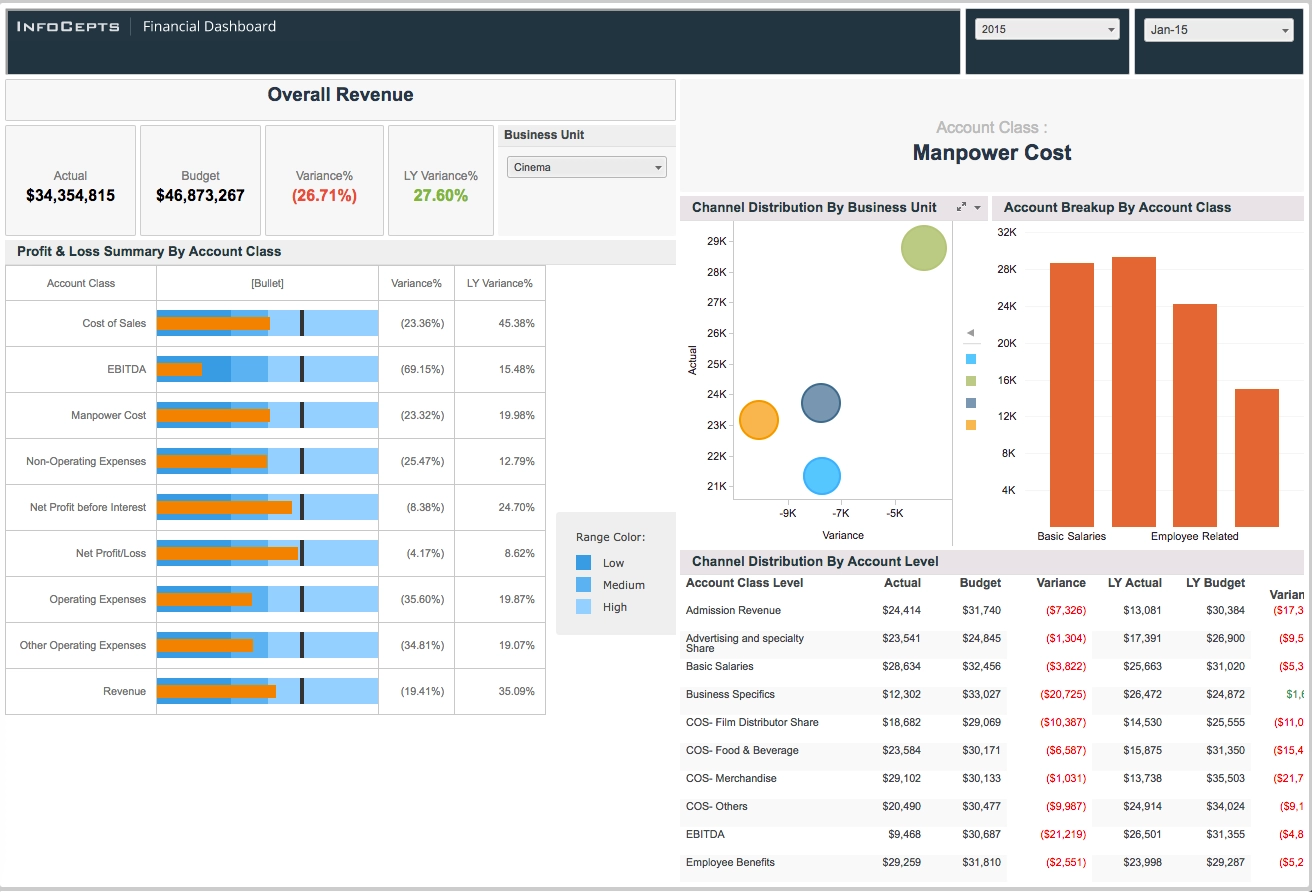
InfoCepts built a financial analytics dashboard that provides a real-time picture of how the various business units are doing in measured by KPIs. Rather than relying on year-end financial statements to paint a picture of performance, this financial analytics dashboard allows management (users and managers) to make decisions when they see emerging problems from negative variances. It also helps the users analyze trends over the past year and forecasts future predictions.
Interact with this dashboard on the cloud.
Download and play on Desktop.