EducationSoftwareStrategy.com
StrategyCommunity

Knowledge Base

Product

Community

Knowledge Base

TopicsBrowse ArticlesDeveloper Zone

Product

Download SoftwareProduct DocumentationSecurity Hub

Education

Tutorial VideosSolution GalleryEducation courses

Community

GuidelinesGrandmastersEvents
x_social-icon_white.svglinkedin_social-icon_white.svg
Strategy logoCommunity

© Strategy Inc. All Rights Reserved.

LegalTerms of UsePrivacy Policy
  1. Home
  2. Topics

Path Analysis Dashboard by Infocepts


Stefan Zepeda

Salesforce Solutions Architect • Strategy


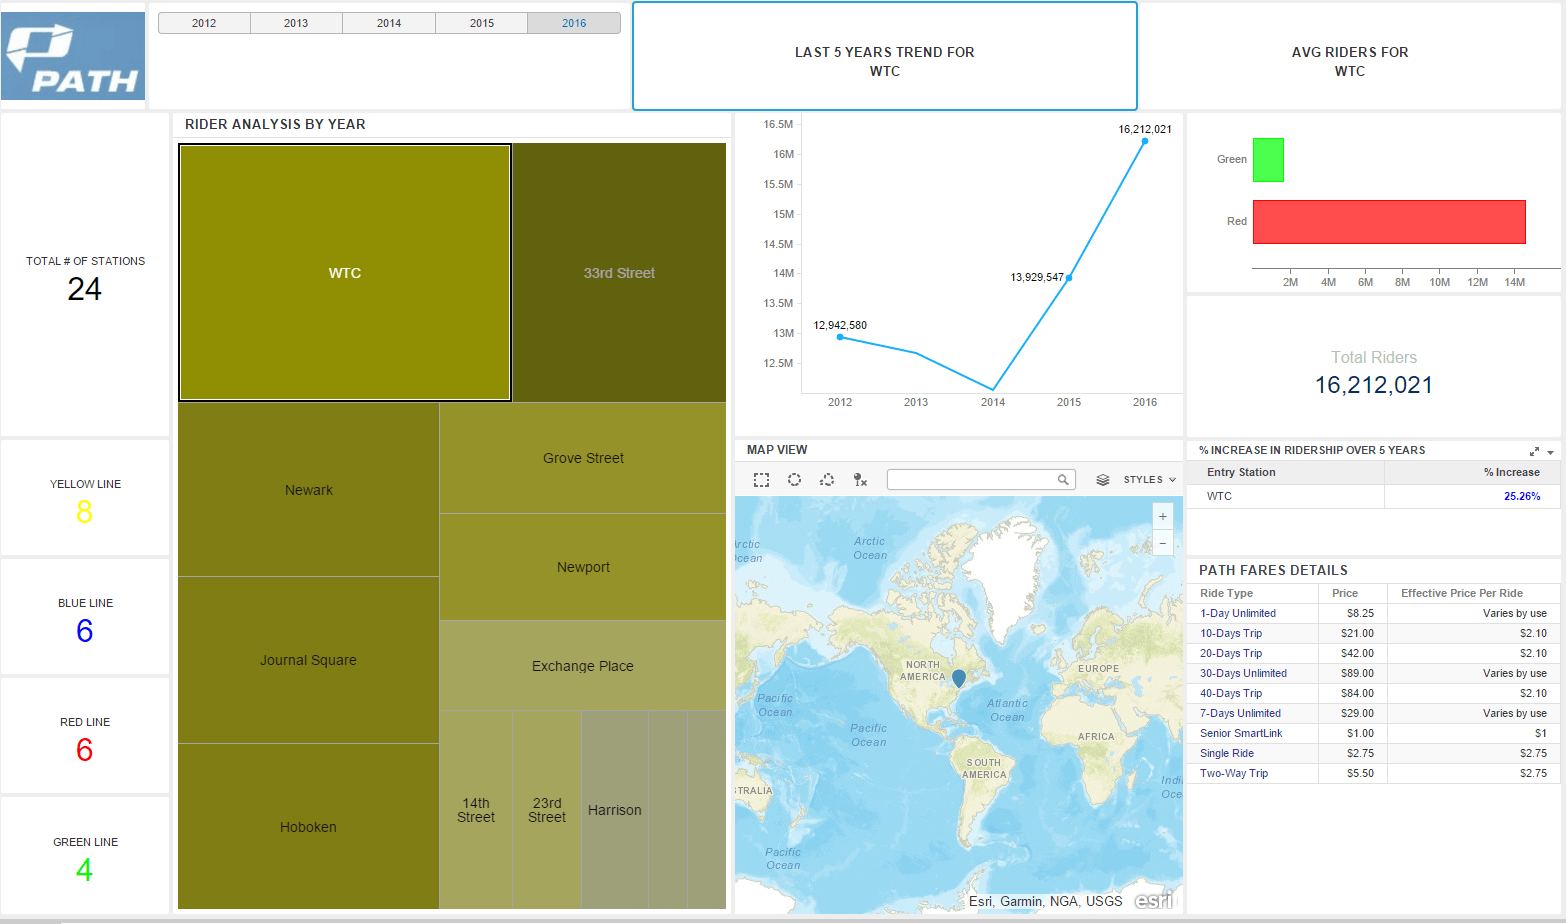
The Port Authority Trans-Hudson (PATH) is a rapid transit rail system connecting New Jersey and New York. InfoCepts built a dashboard to analyze PATH data to uncover a PATH ridership report giving detailed information on the total number of stations on the yellow, blue, red, and green lines, total ridership, and trends over the last five years.
ka02R000000kWA0QAM_0EM440000002K3U.png

The Port Authority Trans-Hudson (PATH) is a rapid transit rail system connecting New Jersey and New York. InfoCepts built a dashboard to analyze PATH data to uncover a PATH ridership report giving detailed information on the total number of stations on the yellow, blue, red, and green lines, total ridership, and trends over the last five years. The dashboard analyzes the most-traveled trips to help management better understand how people use the system and a time period analysis shows traffic and average travel time between two stations for various time periods. From within Strategy, users can access the PATH website to reference alerts, advisories, and other information.
Interact with this dashboard on the cloud.
Download and play on Desktop.  


Comment

0 comments

Details

Example

Published:

April 25, 2017

Last Updated:

May 1, 2017