EducationSoftwareStrategy.com
StrategyCommunity

Knowledge Base

Product

Community

Knowledge Base

TopicsBrowse ArticlesDeveloper Zone

Product

Download SoftwareProduct DocumentationSecurity Hub

Education

Tutorial VideosSolution GalleryEducation courses

Community

GuidelinesGrandmastersEvents
x_social-icon_white.svglinkedin_social-icon_white.svg
Strategy logoCommunity

© Strategy Inc. All Rights Reserved.

LegalTerms of UsePrivacy Policy
  1. Home
  2. Topics
  3. Interactive Maps

Interactive Maps


Nida Imtiaz

Product Manager, Senior • Strategy


Add map visualizations to your dossier, to display your data as map markers on an interactive map. Use this article as a reference to know some quick facts about them. You can even download the dossier to view and interact with, on MicroStrategy Desktop.

Starting with the release of Strategy ONE (March 2024), dossiers are also known as dashboards.
A map is a spatial detail which is composed of one or many layers. A layer is the way in which ESRI Maps for Strategy visually represents geographic datasets.  A layer is similar to a legend item on a paper map. For example, on a road map, roads, national parks, political boundaries, and rivers might be considered different layers. When you add Strategy business data to a map, Esri Maps for Strategy creates a layer and displays it on the Contents pane. Once the layer is created, you can configure how it is styled, set its transparency, enable clustering or heat maps, turn on pop-up windows, and so on. 
 
You can add a Map visualization to your dossier, to display your data as map markers on an interactive map. You can use the visualization to:

  • Filter the map markers shown in the visualization by selecting map markers for which to display data.
  • Display map markers as static images in the visualization, or display the map markers as dynamic bubbles. If you choose to display the map markers as dynamic bubbles, the size of each dynamic bubble is automatically determined based on the value of the metric used to display the map markers, with the largest bubbles being displayed for the largest metric values.

In the image below, you can view different layers used to compare different attributes and metrics on the map.

ka0PW0000001JOlYAM_0EM44000000Q9pg.png

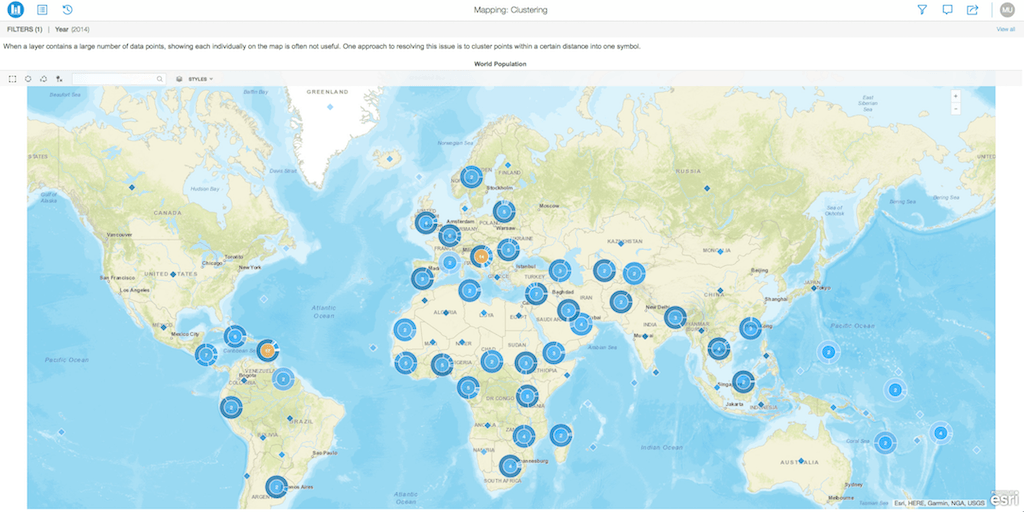
In the image below, you can view clusters on various data points on the map.
ka0PW0000001JOlYAM_0EM44000000Q9pl.png

Requirements:

  • Attributes: 1 or more
  • Metrics: 1 or more
  • Geo Attribute: Latitude & Longitude
  • Angle: 1 or more metric
  • Color By:  1 or more metric

 
Minimum Strategy version: 10.9
Publisher: Strategy 
Installation Instructions:

  • To view this dossier with the visualization, download the .mstr file below and deploy it in Strategy Desktop or Strategy Web.
  • You can open a working demo by uploading the .mstr file below and doing the following:
    • To open the demo visualization in Strategy Desktop, double click the .mstr file.
    • To open the demo visualization in Strategy Web, choose Create -> Upload Strategy File -> View Dossier.

Analyze using maps by downloading MicroStrategy Desktop!
References:
 
Esri Maps of Strategy, Esri. Retrieved from https://doc.arcgis.com/en/maps-for-microstrategy/1.0.1/design-and-use-map/add-microstrategy-data-to-your-map.htm


Comment

0 comments

Details

Example

Published:

December 5, 2017

Last Updated:

March 21, 2024