Starting with the release of Strategy ONE (March 2024), dossiers are also known as dashboards.
We are adding three new visualizations to dossier authoring in Strategy 10.11. Histogram, Waterfall, and Box Plot are some of the key visualizations you have asked us to provide OOTB. Thank you for your continuous feedback on making our visualization library more robust.
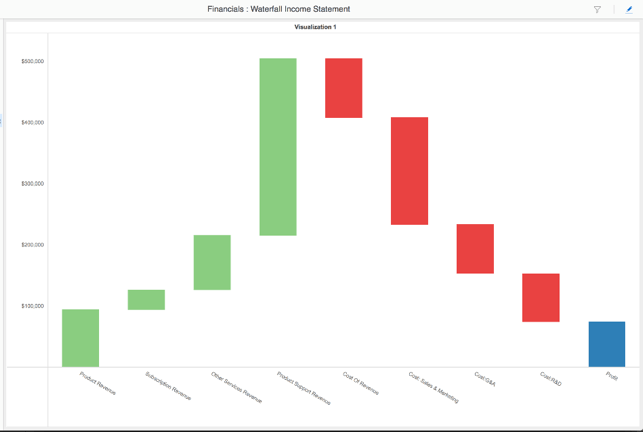
Waterfall
A waterfall charts show how an initial value is impacted by subsequently introduced positive and negatives values. The color of the floating bars depicts the impact of the intermediate values. By default, positive impact is represented in green, negative impact is represented in red and the final value is represented in blue. Authors have the flexibility to change the sentiment colors based on their use case.
Waterfall can be used to visualize answers to key critical business questions such as the following.
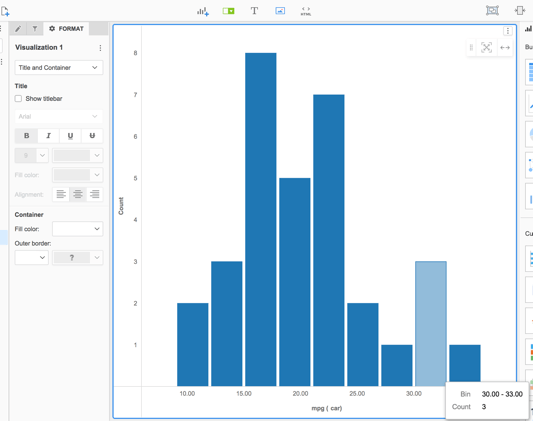
Histogram
The histogram visualization is used to graphically reveal the underlying frequency distribution of a metric. For example, is it a normal distribution, is the data skewed, etc..
The data is divided into intervals, called bins. Each bin displays the number of occurrences of values in the data set that are contained within that bin. In a histogram, the height of the bar indicates the frequency of that bin.
Authors will have the flexibility to configure the histogram by changing the default bin configuration. Authors can either specify the number of bins they would like the data to be segmented in or the size of each bin.
A histogram is extremely useful to visualize answers to key critical business questions such as:
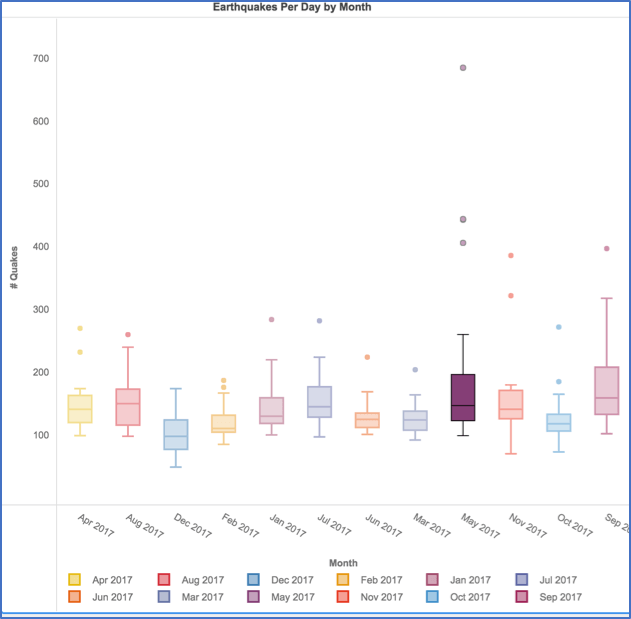
Box Plot
The box plot is a popular way to display summary statistics (distribution, variability, median, and quartiles) for data across multiple attributes like example, months, regions, categories. A box plot can help you quickly identify outliers within group or identify a group that is significantly different from others.
This visual is a standardized way of displaying the distribution of data based on five data measurements: the minimum, the first quartile, the median, the third quartile, and the maximum. The boxes in a box plot are the first and third quartiles of the data with a line indicating the median value. The whiskers, indicate the minimum and maximum with lines extending to the minimum and maximum values on either side of a box. Outliers, values far outside the likely variability in the data, can be removed from the box plot.
For example, the box plot here shows the distribution of number of earth quakes per day by month. Right from the start you will notice that May 2017 has the most outliers, and that the data from June has the least variability.
Want to try it?
Note: These three visualizations are supported for dossier on Strategy Desktop, Strategy Workstation, Strategy Web, and Strategy Library (Library app included).