EducationSoftwareStrategy.com
StrategyCommunity

Knowledge Base

Product

Community

Knowledge Base

TopicsBrowse ArticlesDeveloper Zone

Product

Download SoftwareProduct DocumentationSecurity Hub

Education

Tutorial VideosSolution GalleryEducation courses

Community

GuidelinesGrandmastersEvents
x_social-icon_white.svglinkedin_social-icon_white.svg
Strategy logoCommunity

© Strategy Inc. All Rights Reserved.

LegalTerms of UsePrivacy Policy
  1. Home
  2. Topics

Invert the threshold color in the Smart KPI widget


Lauren O'Connor

Vice President, Product Marketing • MicroStrategy


Starting with the release of Strategy ONE (March 2024), dossiers are also known as dashboards.
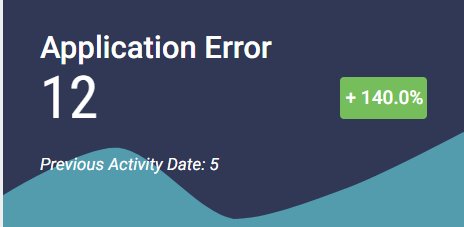
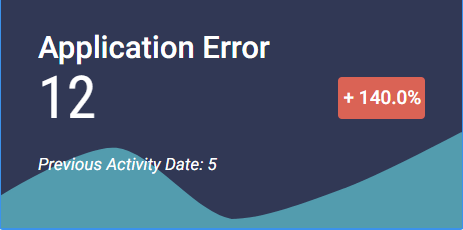
When using a Smart KPI widget in a dossier to evaluate important performance indicators, you can invert the threshold color of the growth indicator to show net change. In the example below, application error is automatically shown as green because errors have gone up. However, you want to show that the increase in errors is negative, so you want to change the threshold to red.

ka0PW0000001JQHYA2_0EM44000000WSVo.png

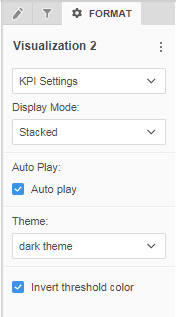
To change the threshold color:

  • Select the Format panel.
  • In the first drop down menu, select KPI Settings.
ka0PW0000001JQHYA2_0EM44000000WSVt.png
  • ​Select Invert threshold color. The threshold will change to red or green.


ka0PW0000001JQHYA2_0EM44000000WUmh.png


KB441026


Comment

0 comments

Details

Knowledge Article

Published:

June 13, 2018

Last Updated:

March 21, 2024