Starting with the release of Strategy ONE (March 2024), dossiers are also known as dashboards.
Imagine you are a retailer and have a few shops in the city. You want to pin those shops to the map and draw a line around each one. This line should mark the area from which it will take up to 5 minutes walk to get to the store. Or 10 minutes walk. Or maybe 15 minutes car drive.
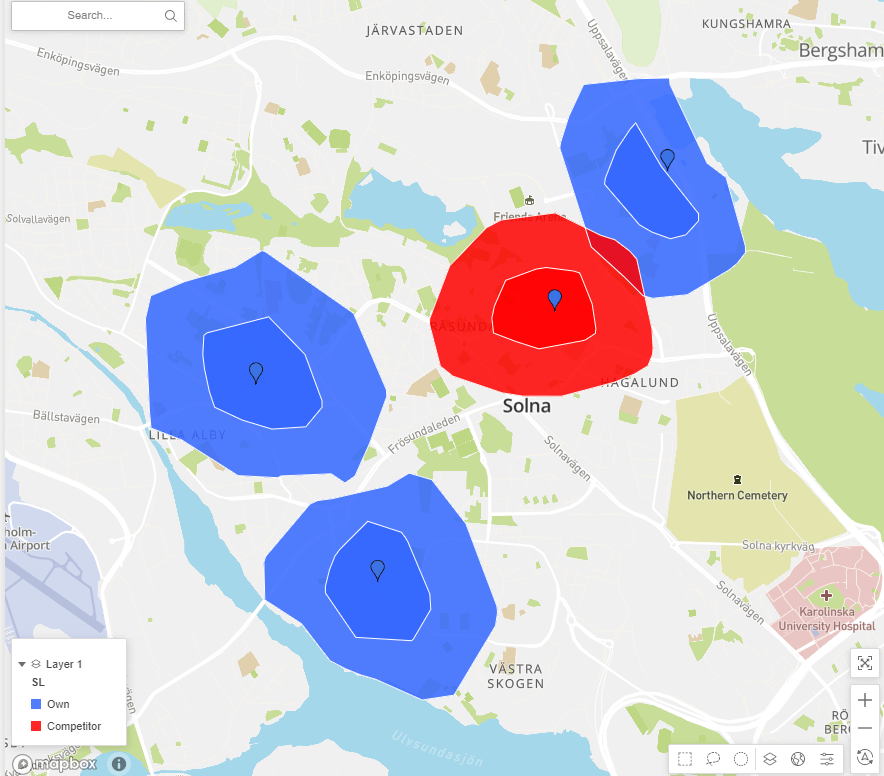
All customer facing business like retail, banking, insurance, restaurants are spending a lot of time and resources on picking the right locations for new branches. You need to take into consideration total area covered, population living there and presence and reach of your competitors. Strategy Maps with isochrones will be of great help in such analysis.
See the video below for a detailed solution overview:
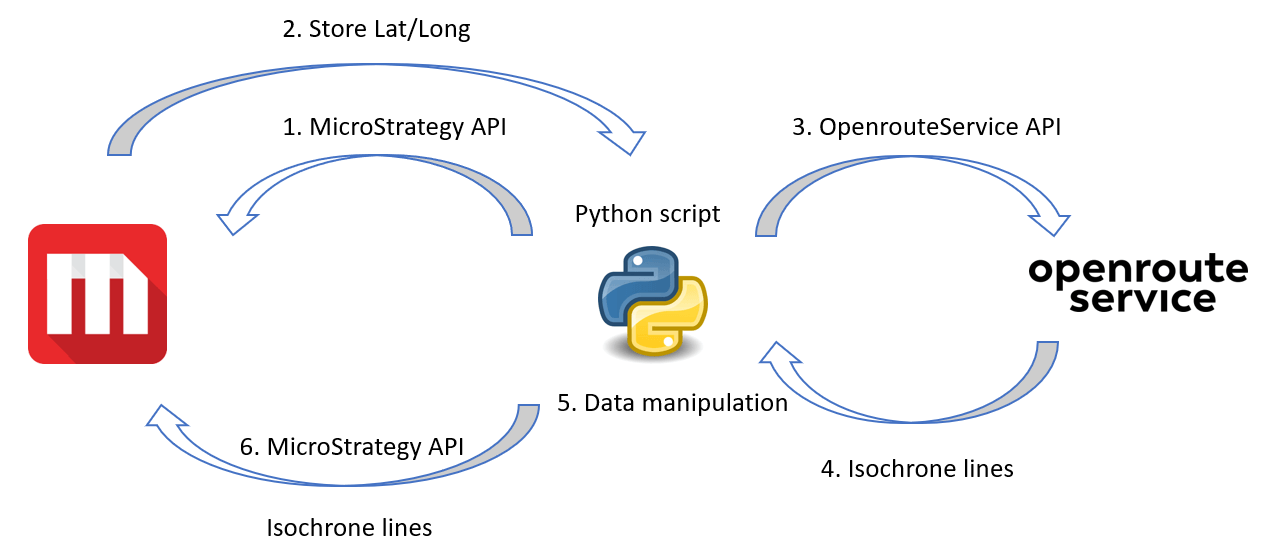
The solution workflow diagram:
Attached to this article are:
- mstr file with example dossier
- Jupyter Notebook file with the Python code used
Below is the Python code that is being used to retrieve isochrone from openrouteservice. It also converts JSON data returned by openrouteservice into JSON format that can be accepted by Strategy APIs and Strategy map.
import openrouteservice as ors
import folium
import credentials # this credentials.py file contains openrouteservice API key
import pandas as pd
import csv

# client performs requests to the ORS API services
client = ors.Client(key=credentials.ors_key)

# coordinates
coordinates_example = [[15.621174, 60.620487],[15.732967751582299, 60.59353408513482]]

# Coordinates
coordinates = coordinates_example

# parameters
profile    = "foot-walking" # driving-car, foot-walking
range_m    = [900] # 600 seconds = 10 minutes
smoothing  = 25
range_type ='time'

# isochrone
isochrone = client.isochrones(locations=coordinates,
                              range_type=range_type,
                              range=range_m,
                              profile=profile,
                              smoothing=smoothing,
                              attributes=['total_pop','area'])

coordinates = Store_data_df[['Longitude','Latitude']].values.tolist()
coordinates_ID = Store_data_df[['Longitude','Latitude','S ID']].values.tolist()

polygons_list=[] # get polygons coordinates
for f in isochrone['features']:
    point_dict={"type":"GeometryCollection","geometries":[{"type":"Polygon","coordinates":f["geometry"]["coordinates"]}]}
    points_str=str(point_dict).replace("'",'"') #convert into string, fix single quote issue
    map_type=(f"{profile} ({str(range_m[0])} sec)") # name of polygon type
    polygons_list.extend([[map_type,f["properties"]['group_index'],f["properties"]['total_pop'],
                           f["properties"]['area'],points_str]])


new_polygons=[] # add Store ID from original list of Stores
for a,b in zip(coordinates_ID, polygons_list):
    new_polygons.extend([a+b])

polygons_df = DataFrame(new_polygons,columns=['Longitude','Latitude','Store_ID','Map_type',
                                              'Index','Population','Area','Polygon_coords'])