Strategy Web, statistics can be used to troubleshoot issues with hanging or slow performance of certain Strategy objects, such as reports or prompts. With these statistic logs, administrators can observe the amount of time spent on each step of the process for a certain task in Strategy Web.
In order to enable these logs, access the Web Administrator page of your Strategy Web application and go to the section for Diagnostics -> Statistics as shown in the image as follows:
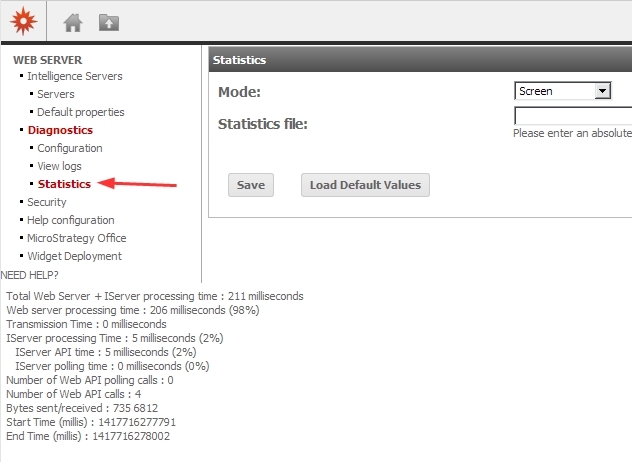
There are two different modes of logging statistics for Strategy Web:
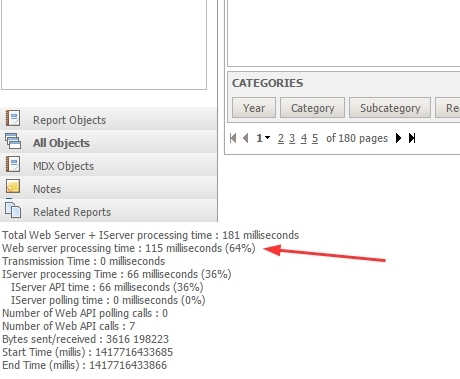
If the statistics are activated on the screen level, users will see a summary of the execution, as illustrated in the following screen shot:
To log to your screen, select 'Screen' from the Mode dropdown. Statistics should show up immediately after the setting is saved.
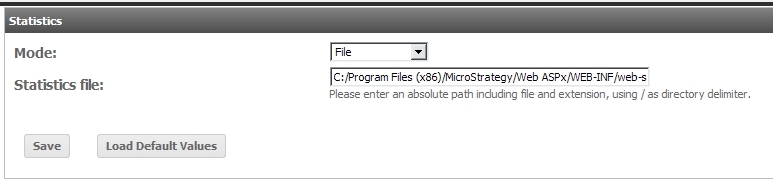
Logging to File works similarly. Instead of displaying statistics on-screen, the statistics will be written to a text file. The content of the file will show entries similar to the one shown in the following example, with the most recent entries on the bottom:
Total Web Server + IServer processing time (milliseconds) :    5
Web server processing time (milliseconds, %) :    3    60
Transmission Time (milliseconds) :    0
IServer processing time (milliseconds, %) :    2    40
IServer API time (milliseconds, %) :    2    40
IServer polling time (milliseconds, %) :    0    0
Number of Web API polling calls :    0
Number of Web API calls :    3
Bytes sent/received :    672    338
Start Time (millis) :     1417716873485
End Time (millis) :     1417716873490
The 'Start Time' and 'End Time' are for each request made from the client machine, or to put it another way, a mouse click.
To convert these Start/End times to a human readable timestamp, you can use the following website or a similar website:
http://www.epochconverter.com/
For more details on troubleshooting performance in Strategy Web, please refer to KB19625: Dashboard Performance Troubleshooting .