EducationSoftwareStrategy.com
StrategyCommunity

Knowledge Base

Product

Community

Knowledge Base

TopicsBrowse ArticlesDeveloper Zone

Product

Download SoftwareProduct DocumentationSecurity Hub

Education

Tutorial VideosSolution GalleryEducation courses

Community

GuidelinesGrandmastersEvents
x_social-icon_white.svglinkedin_social-icon_white.svg
Strategy logoCommunity

© Strategy Inc. All Rights Reserved.

LegalTerms of UsePrivacy Policy
  1. Home
  2. Topics

KB10674: How to format the Grid/Graph view of a report to display the grid above or below the graph in MicroStrategy Developer 9.4.x-10.x


Stefan Zepeda

Salesforce Solutions Architect • Strategy


In MicroStrategy Developer, when viewing a report in Grid/Graph mode, the grid appears to the left of the graph by default. However, MicroStrategy Developer can be formatted in such a way that the graph will appear either above or below the grid.
In Strategy Developer, when viewing a report in Grid/Graph mode, the grid appears to the left of the graph by default. However, Strategy Developer can be formatted in such a way that the graph will appear either above or below the grid.
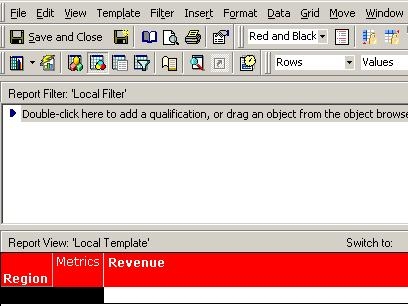
  • Consider a report with 'Region' as the attribute and 'Revenue' as the metric, as illustrated below:
ka02R000000kcRWQAY_0EM440000002Frr.jpeg
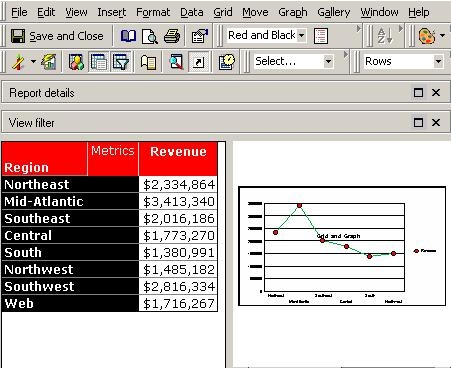
  • View the report in Grid/Graph mode. By default, the grid will appear on the left of the graph:
ka02R000000kcRWQAY_0EM440000002Fro.jpeg
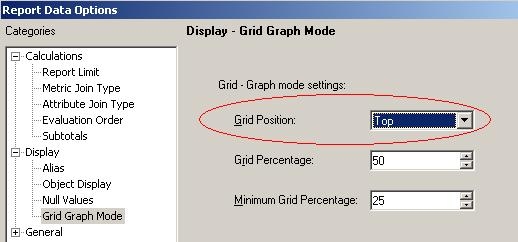
  • In order to make the grid appear above the graph, go to Data > Report Data Options > Display > Grid Graph Mode. Change the grid position to 'Top':
ka02R000000kcRWQAY_0EM440000002Frp.jpeg
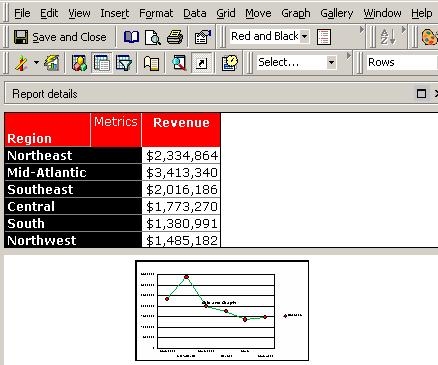
  • The grid will appear above the graph, as shown in the following screen shot:
ka02R000000kcRWQAY_0EM440000002Frm.jpeg

Note: To make the grid appear below the graph, choose 'Below' as the grid position in Report Data Options.


Comment

0 comments

Details

Knowledge Article

Published:

April 21, 2017

Last Updated:

April 21, 2017