EducationSoftwareStrategy.com
StrategyCommunity

Knowledge Base

Product

Community

Knowledge Base

TopicsBrowse ArticlesDeveloper Zone

Product

Download SoftwareProduct DocumentationSecurity Hub

Education

Tutorial VideosSolution GalleryEducation courses

Community

GuidelinesGrandmastersEvents
x_social-icon_white.svglinkedin_social-icon_white.svg
Strategy logoCommunity

© Strategy Inc. All Rights Reserved.

LegalTerms of UsePrivacy Policy
  1. Home
  2. Topics

KB10675: How to customize a color for an attribute value in graphs for MicroStrategy Developer


Stefan Zepeda

Salesforce Solutions Architect • Strategy


How to customize a color for an attribute value in graphs for MicroStrategy Developer

In Strategy an attribute value can be associated with a color when viewing a graph. By default, the colors that appear in a graph follow a pre-defined pattern of colors. However, a particular color can be customized for an attribute value using thresholds.
 

  • Consider the following report, with the 'Region' attribute on the columns, and the 'Revenue' metric on the rows:
ka02R000000kbleQAA_0EM440000002FrM.jpeg
  • View this report in graph view (in this example, as a vertical bar). Notice that the graph colors follow the default pre-defined pattern of colors:
ka02R000000kbleQAA_0EM440000002FrH.jpeg
  • To associate the 'Northeast' attribute value to the color black, a threshold must be created. To do this, go to Data > Thresholds and click on 'Click here' to start a new qualification.
  • For the Field section, choose Region, choose 'In list' for the Operator. For Value, click on select elements.
  • Select Northeast and move it to the right side.
  • In the Format Definition section, click on Cell Formatting. On the Background tab in the Format Cells editor and select 'Solid' as background style and choose black as the color for the 'Fill' drop-down.
ka02R000000kbleQAA_0EM440000002FrK.jpeg
  • Check the checkbox 'Apply background color as a graph threshold,' as seen below:
ka02R000000kbleQAA_0EM440000002FrI.jpeg
  • Click OK.

View the report as a graph and notice that the Northeast attribute value appears in black. Also note that the legend will not be updated to show the new color:
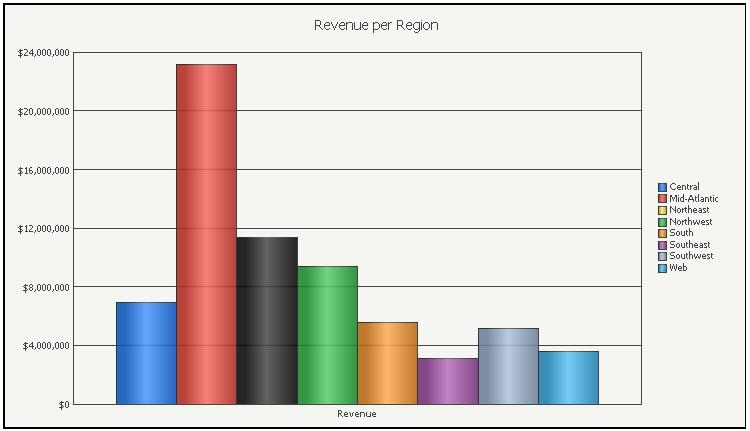
ka02R000000kbleQAA_0EM440000002FrY.jpeg

 
NOTE:
This change will not be reflected if this report is closed and a new one is created. However, by going back to design view and adding/removing objects, the black color will be sustained for the Northeast attribute value.


Comment

0 comments

Details

Knowledge Article

Published:

June 8, 2017

Last Updated:

June 8, 2017