EducationSoftwareStrategy.com
StrategyCommunity

Knowledge Base

Product

Community

Knowledge Base

TopicsBrowse ArticlesDeveloper Zone

Product

Download SoftwareProduct DocumentationSecurity Hub

Education

Tutorial VideosSolution GalleryEducation courses

Community

GuidelinesGrandmastersEvents
x_social-icon_white.svglinkedin_social-icon_white.svg
Strategy logoCommunity

© Strategy Inc. All Rights Reserved.

LegalTerms of UsePrivacy Policy
  1. Home
  2. Topics

KB10676: How to customize the colors appearing on a graph so the new color sequence is reflected across each report created in MicroStrategy Developer


Stefan Zepeda

Salesforce Solutions Architect • Strategy


How to customize the colors appearing on a graph so the new color sequence is reflected across each report created in MicroStrategy Developer

Graphs in Strategy follow a pre-defined pattern of colors. The pattern always begins with the color red, green, yellow, etc. The pre-defined pattern of colors can be customized and saved as a template. To do this, perform the following steps:

  • Consider the following report where the 'Region' attribute appears on the columns and the 'Revenue' metric appears on the rows. View this as a graph (in this case, a horizontal graph).
  • Notice in the screen shot below that the default colors are shown on the graph:
ka02R000000kX0EQAU_0EM440000002Frh.jpeg
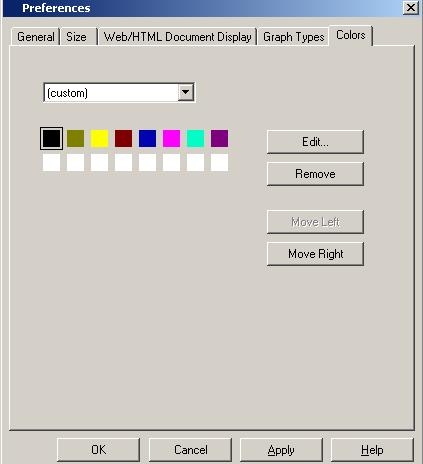
  • These colors come in a series with the first one always being red, then green, yellow, etc. After a certain number, this color series appears again. The screen shot below displays the pre-defined pattern of colors displayed in a graph (Graph > Preferences > Colors):
ka02R000000kX0EQAU_0EM440000002FrV.jpeg
  • To change the first color in the sequence from red to black, click on the red segment, and click Edit. Choose the color black and click OK. The first color in the pattern will now be changed to black and will be reflected in the graph, as shown below:
ka02R000000kX0EQAU_0EM440000002FrW.jpeg
  • Alternatively, users can right-click on the red segment in the graph, and go to Format Bar Riser. Change the color to black in the 'Fill' tab:
ka02R000000kX0EQAU_0EM440000002Frg.jpeg
  • When changing the color using either of the two methods described above, the change will not be reflected in the next report created. The next report will appear with the default colors seen in the above screen shot.
  • Once the color sequence has been changed as desired, go to Graph > Save Graph Style and save the newly created graph template.
  • Create a new report with the attribute 'Region' and metric 'Revenue' as the first report.
  • Notice that the graph appears in the default pre-defined sequence of colors. Go to Graph > Apply Graph Style and choose the graph template.

The graph will appear with the first segment in black as defined in the template.
 
NOTE:

  • The template does not assign a particular color to an attribute and instead customizes the pre-defined pattern of graph colors.
  • For more information on this topic, refer to the following Strategy Knowledge Base document:
    • KB5700-752-1266 - How to customize a color for an attribute value in graphs for Strategy Desktop

Comment

0 comments

Details

Knowledge Article

Published:

April 12, 2017

Last Updated:

April 12, 2017