The 3-D scatter graph is found under the graph style: Scatter > X-Y-Z Scatter Chart.
To set up a 3-D scatter graph, the template must consist of the following:
An example report with the same characteristics is shown below:
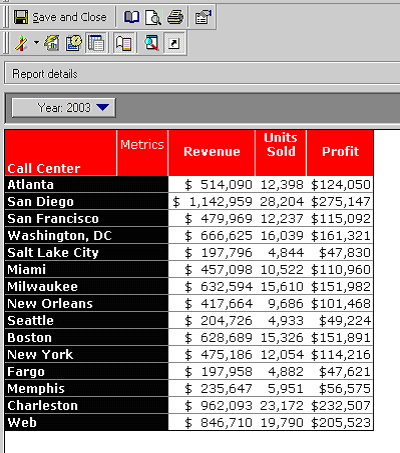
The Axis is set up as follows:
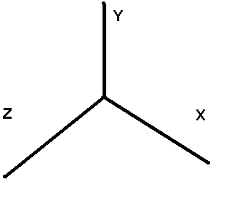
Below is the graphical representation of the grid:
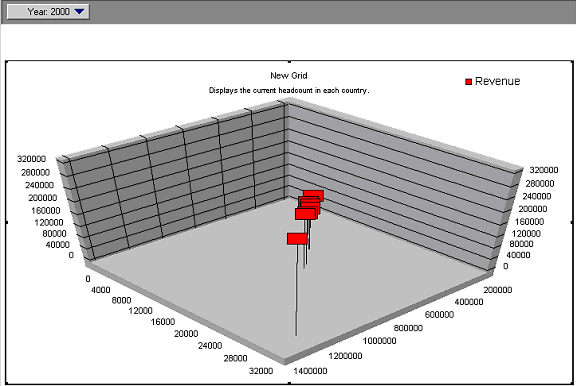
To have the attributes shown as the data markers, change the series to Set Series By Rows:
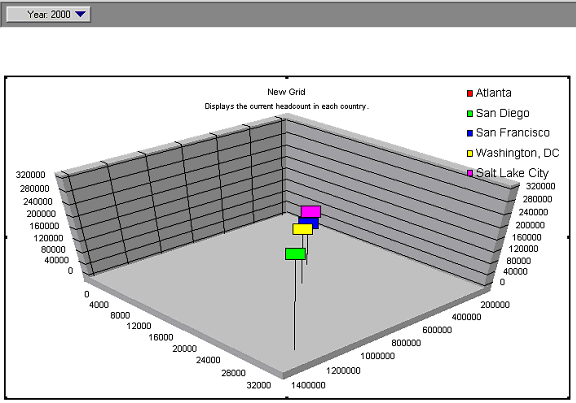
Below is the resulting graph:
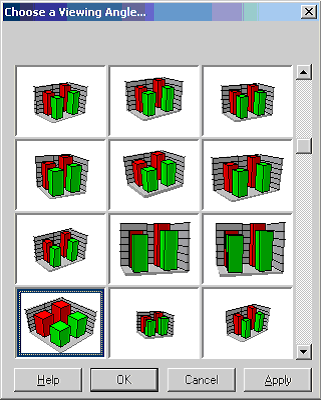
To change the layout of the walls, in the top menu bar, go to Graph > 3-D Settings:
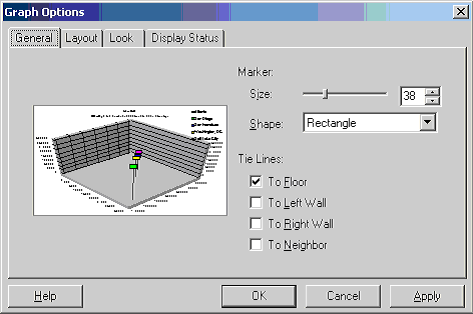
To change other properties, go to Graph > Graph Options: