When executing a bar graph report in Strategy Developer, the graph series may be customized by selecting the following menu option in the graph editor: Graph > Series Options.
The following screen shot illustrates the pop-up box that appears after selecting this option:
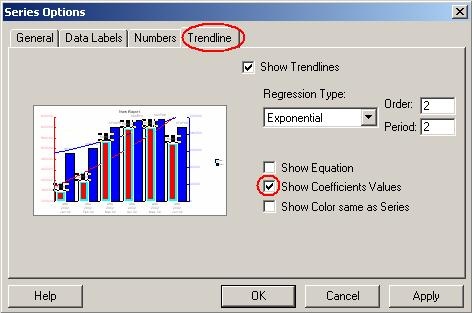
Notice that under the Trendline tab, there is an option to "Show Coefficients Values."
Question: What statistical function is used to calculate the linear regression coefficient for trend lines in graphs when using Strategy Developer 9.x?
Answer: The Strategy 3rd party vendor for graph components is called 3D Graphics which uses the Pearson function.
Third Party Software Installation:
WARNING:
The third-party product(s) discussed in this technical note is manufactured by vendors independent of Strategy. Strategy makes no warranty, express, implied or otherwise, regarding this product, including its performance or reliability.