By default, when an attribute is added to the 'Grouping' section of a Report Services document containing a grid in the document body, the display of a Grand Total will not be shown for the metric over the entire document. Rather, the totals are displayed for each grouped-by attribute and are shown at the bottom of each separat grid.
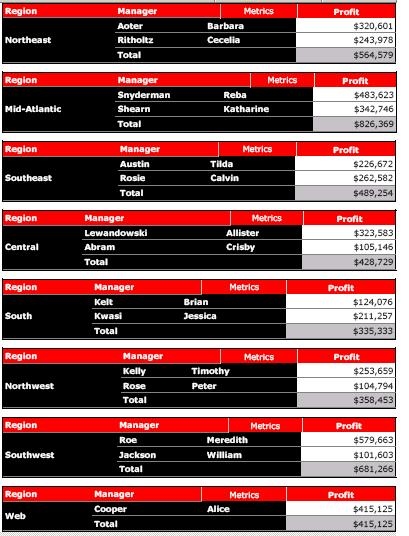
The following screen shots illustrate how a document might appear if it is grouped-by attribute 'Region.' Each grand total of Profit is shown for each Region. The document does not display the overall Grand Total for all Profit values in the document:
Currently, there are two ways to display an overall grand total value within a Report Services document while still maintaining a group-by feel.
Option 1:
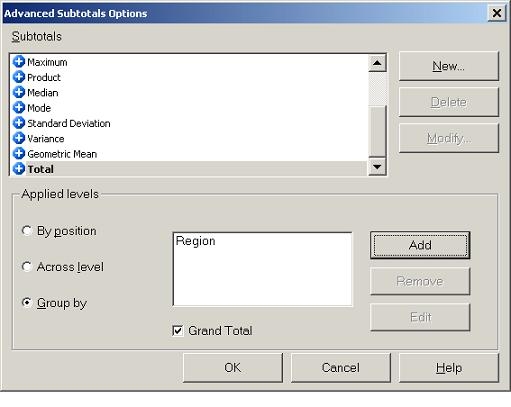
The first method requires that the 'Grouping' attribute be removed from the document. Once this is done, the subtotal display within the dataset can be changed so that it is grouped by the attribute that was formerly in the group by section of the document:
Once this has been completed and the grand total enabled, the report will appear similar to the following:
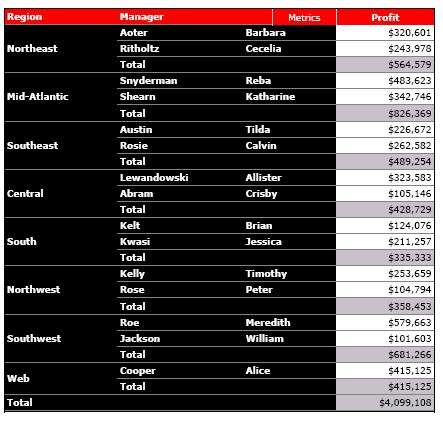
Although this method does not allow for the grid to appear broken up, the subtotals for each grouped-by attribute are displayed on the document along with the grand total for the entire metric.
Option 2:
The second option requires that a Static text field called 'Grand Total' be added to the Document Footer section. Then, the Profit metric from the dataset should be dragged into the 'Document Footer' section as dynamic text. Upon executing the document, the Grand Total is seen in at the bottom of the document.
