EducationSoftwareStrategy.com
StrategyCommunity

Knowledge Base

Product

Community

Knowledge Base

TopicsBrowse ArticlesDeveloper Zone

Product

Download SoftwareProduct DocumentationSecurity Hub

Education

Tutorial VideosSolution GalleryEducation courses

Community

GuidelinesGrandmastersEvents
x_social-icon_white.svglinkedin_social-icon_white.svg
Strategy logoCommunity

© Strategy Inc. All Rights Reserved.

LegalTerms of UsePrivacy Policy
  1. Home
  2. Topics

KB12060: How to calculate the top percent value of a metric based on the Total versus the Row count in MicroStrategy Developer 9.x-10.x


Stefan Zepeda

Salesforce Solutions Architect • Strategy


How to calculate the top percent value of a metric based on the Total versus the Row count in MicroStrategy Developer 9.x-10.x

Users have the option of setting a certain percentage of a metric's values to be displayed by using the 'Top' operator in the Report Editor. However, using the Top operator shows only the Top percent of values based on the row count, not on the Total for the rows.
 
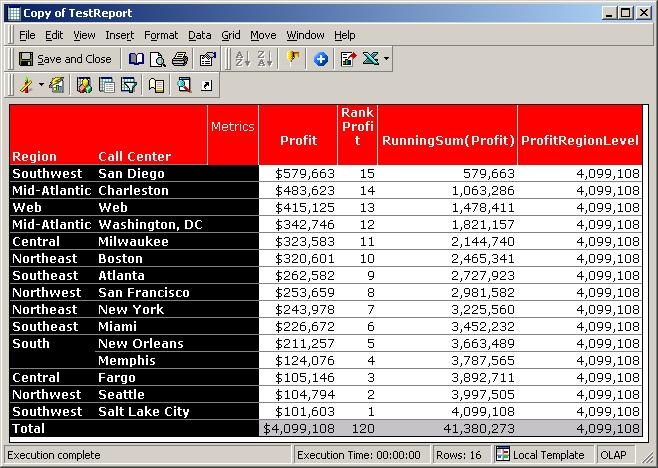
Suppose that a user has the following report:
 

ka02R000000kcafQAA_0EM440000002FiJ.jpeg

 
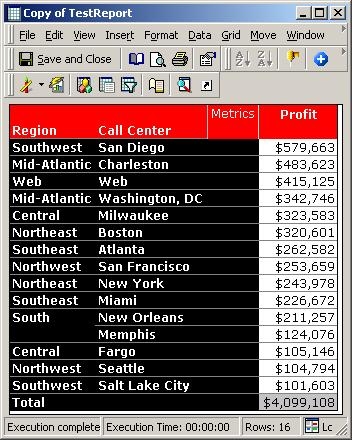
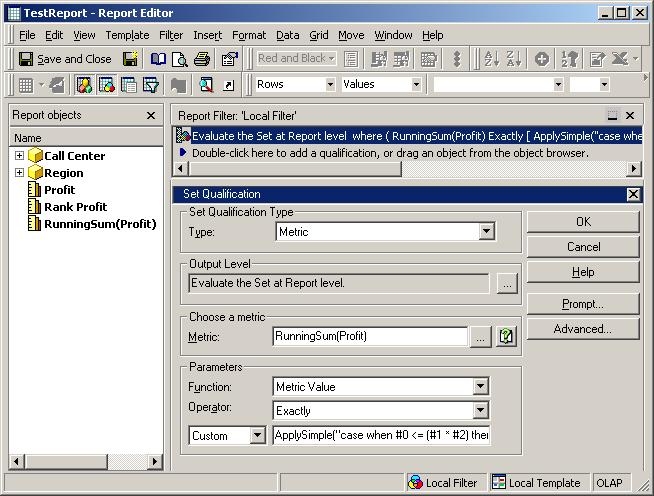
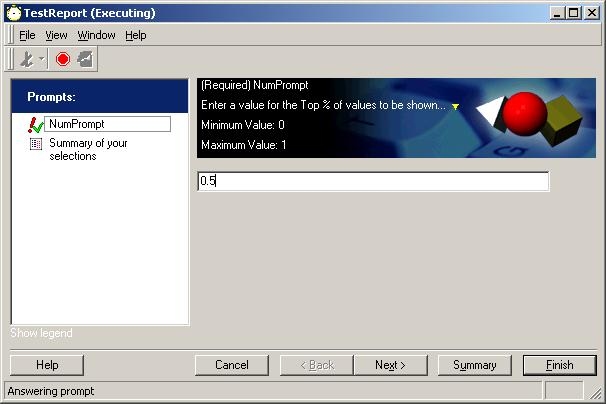
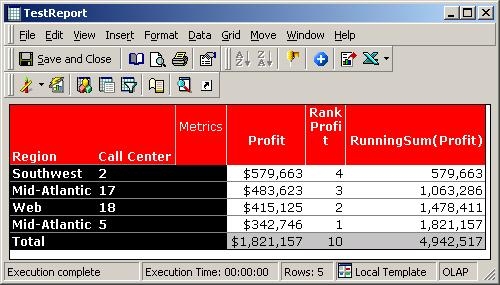
The user wants to display only the Top 50% based on the sum total of $4,099,108 ranking the results from highest to lowest. In this example, only results where the total is greater than $2,049,553 should be displayed. To achieve this complete the following steps:
 

  • Create a metric that is defined as 'Rank(Profit)' as in the image below:
ka02R000000kcafQAA_0EM440000002FiB.jpeg
  • Save the metric as 'Rank Profit.'
     
  • Create another metric that is defined as 'RunningSum()' as shown in the image below:
     
ka02R000000kcafQAA_0EM440000002FiR.jpeg
  • Highlight and right-click on 'RunningSum.' Set the 'Sort-by' on with the Order set to Descending as shown in the image below:
ka02R000000kcafQAA_0EM440000002FiQ.jpeg
  • Save and close as 'RunningSum(Profit).'
     
  • Create another metric that is defined as the original metric on the report, 'Sum(Profit),' but change the dimensionality of the Metric to include 'Region' with the Filtering set to 'Standard' and the Grouping set to 'None' as shown in the image below:
ka02R000000kcafQAA_0EM440000002FiF.jpeg
  • Name this metric 'ProfitRegionLevel.'
     
  • Execute the report with the three metrics created above added to the grid. The report shows the individual values, the ranking of the values, and a running sum that adds the values as shown in the image below:
     
ka02R000000kcafQAA_0EM440000002FiL.jpeg

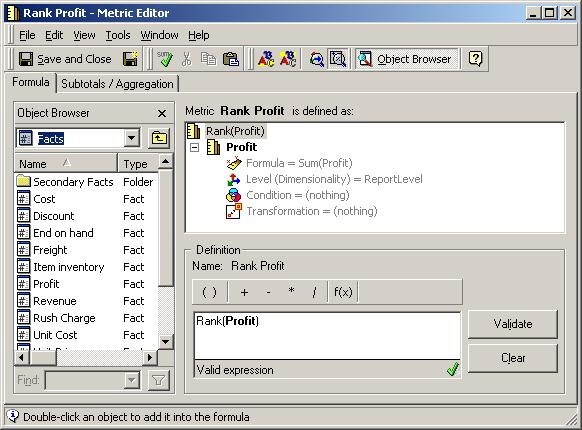
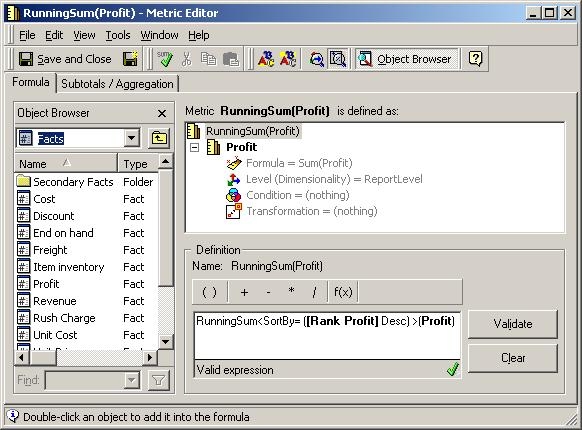
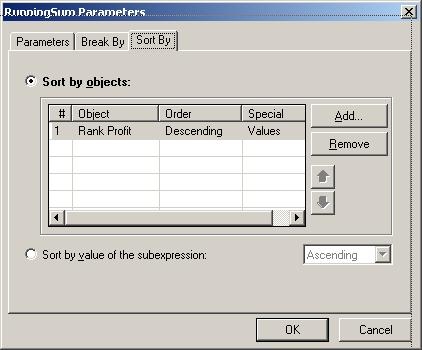
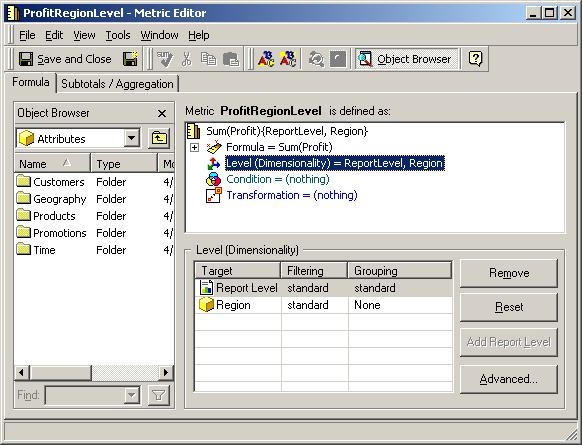
To display values in the top 50% of the total from highest to lowest complete the following steps:

  • Create the following custom filter expression so that users are prompted on the percentage of the Total they would like to display. For example, as simple numeric prompt such as the 'NumPrompt' is created as shown in the image below:
    ApplySimple("case when #0 <= (#1 * #2) then #0 else NULL end",,ProfitRegionLevel, ?)
ka02R000000kcafQAA_0EM440000002FiD.jpeg
  • Execute the report, and answer the prompt to display the desired percentage as shown in the image below. In this example, 50% is chosen:
ka02R000000kcafQAA_0EM440000002FiT.jpeg
  • If users select 50% when prompted, the following results will be displayed:
ka02R000000kcafQAA_0EM440000002FiH.jpeg

Comment

0 comments

Details

Knowledge Article

Published:

April 11, 2017

Last Updated:

April 11, 2017