This technical note explains how to create a graphical view of the tables used within a project in Strategy Developer. This logical view is very similar to an Entity Relationship Diagram and displays all the tables and their relationships including cardinalities and modalities.
The Table Viewer allows users to view the tables and relationships used in a project in Strategy Developer in two views:
Accessing the Table Viewer:
Users can open the Table Editor from the Strategy Developer Schema menu, pointing to Graphical View, and then choosing Tables, as shown below:
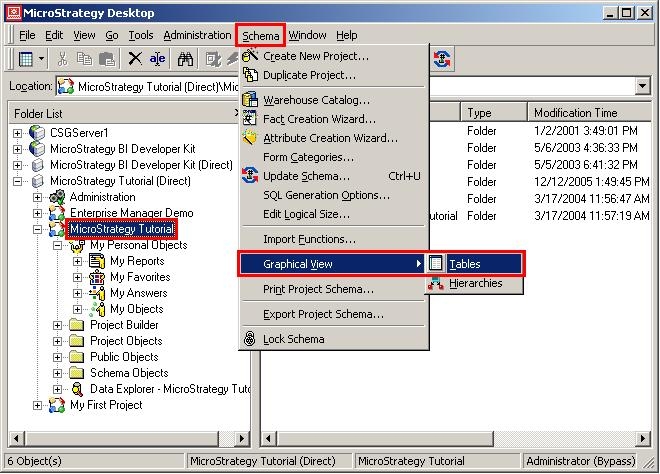
Table Viewer layout:
The Table Viewer initially opens in the physical view, but users can switch to the logical view. However, in both the physical and logical views, the color of the table denotes the table type:
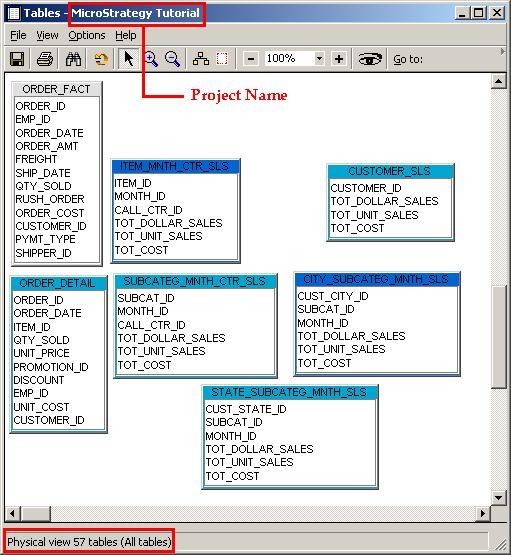
Physical View:
Users can switch to a physical view of the tables, which is a graphical representation of the warehouse. The default view shows the columns in each table and the relationships between the tables, but users can use the Options menu to change the display:
Logical View:
The logical view is a graphical representation of the facts and attributes present in the logical structure of the application. The default logical view displays the facts and attributes of each table. The number in parentheses next to each table name is its logical size. Users can use the Options menu to change the display:
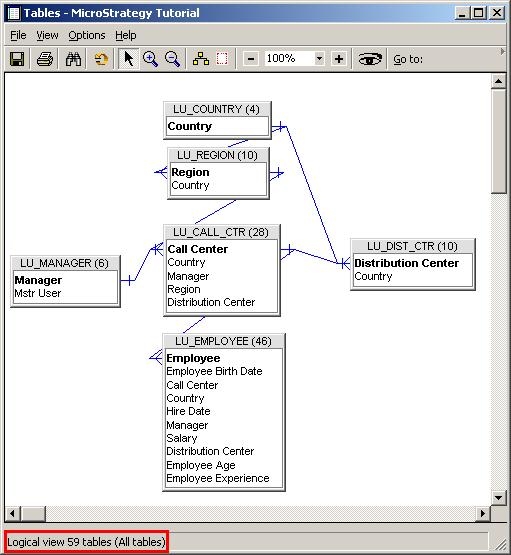
In the default view, the lookup tables are at the top, since they define the relationships between the tables. Next are the fact tables, and at the bottom are the remaining tables. Users can rearrange the view of the tables by dragging and dropping. If the custom view is saved, it is displayed the next time the Table Viewer is accessed. To return to the default view, click Auto arrange in the toolbar.
NOTE: Rearranging the tables does not modify the table or schema structure.
Once a diagram has been created, users can copy it as metafile to use in another program, such as Microsoft Word or Excel. To do this, select Copy as Metafile from the File menu.
The Table Viewer provides the large-scale view of the tables. To drill into the details, right-click a table and select Edit. The Table Editor opens. To access even more specific information, right-click an attribute or fact in the Table Editor and select Edit. The Attribute Editor or Fact Editor opens.
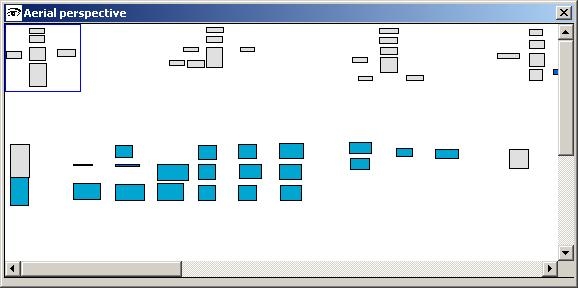
Users can also see an overview of the tables in a separate window called Aerial perspective. Its decreased scale allows users to view and navigate through the entire project, as shown below:
Toolbar Options:
Toolbar options are shown below:
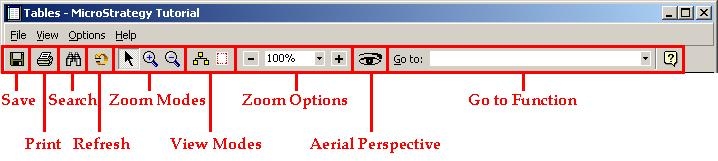
Users can also zoom in and out using the mode buttons on the toolbar (Normal, Zoom In, and Zoom Out). The toolbar also provides a Go to function, allowing users to select an object to view. This is particularly helpful with a large or complicated project schema. Users can access the Search for Objects dialog box to find an object by right-clicking and selecting Search for objects or Search for dependents. To view tables related to a selected table, right-click and choose Select related tables.