EducationSoftwareStrategy.com
StrategyCommunity

Knowledge Base

Product

Community

Knowledge Base

TopicsBrowse ArticlesDeveloper Zone

Product

Download SoftwareProduct DocumentationSecurity Hub

Education

Tutorial VideosSolution GalleryEducation courses

Community

GuidelinesGrandmastersEvents
x_social-icon_white.svglinkedin_social-icon_white.svg
Strategy logoCommunity

© Strategy Inc. All Rights Reserved.

LegalTerms of UsePrivacy Policy
  1. Home
  2. Topics

How to use Custom Line Formatting to create a smooth curve in MicroStrategy Developer


Alejandro Olvera Velasco

Product Manager, Principal • MicroStrategy


Description

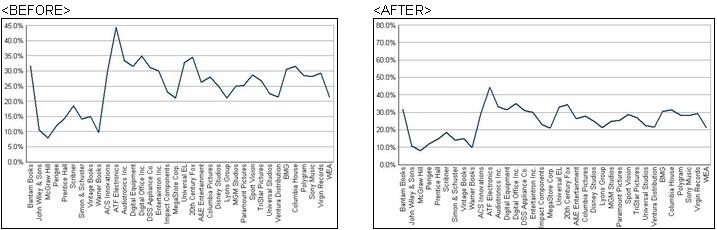
This knowledge base article demonstrates how to change the custom line formatting in Strategy Developer to create smooth curve effects in a report in line graph view. By adding a custom line to the y-axis of a line graph report, the user creates a flattened effect, so it is not as dramatic between the highest value and the lowest value in the line.
The following image illustrates the before and after effect:
 

ka02R000000g2EdQAI_0EM440000002FYD.jpeg


Next Steps for Formatting 

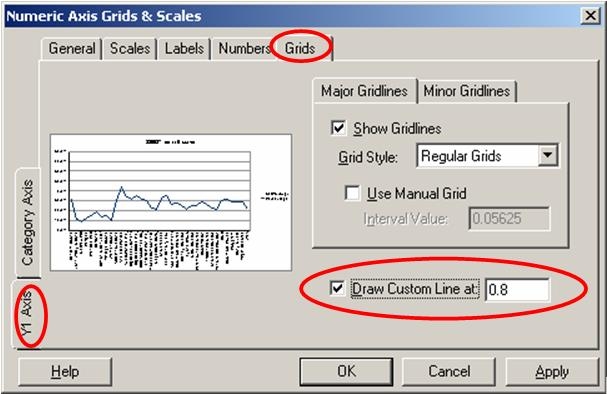
Follow these steps to change the Custom Line Formatting for a smooth curve effect:

  1. Open a report in Line Graph view.
  2. Right-click on the graph and select Grid and Scale.
  3. Under the Grid tab, make sure you are on the Y Axis tab.
  4. ​​​​​​​Check Draw Custom Lines at. 
  5. Provide a number greater than the highest value in the y-axis to create the smooth curve effect.

 
View the following image for reference:
 

ka02R000000g2EdQAI_0EM440000002FYF.jpeg


Comment

0 comments

Details

Knowledge Article

Published:

May 17, 2017

Last Updated:

September 3, 2019