EducationSoftwareStrategy.com
StrategyCommunity

Knowledge Base

Product

Community

Knowledge Base

TopicsBrowse ArticlesDeveloper Zone

Product

Download SoftwareProduct DocumentationSecurity Hub

Education

Tutorial VideosSolution GalleryEducation courses

Community

GuidelinesGrandmastersEvents
x_social-icon_white.svglinkedin_social-icon_white.svg
Strategy logoCommunity

© Strategy Inc. All Rights Reserved.

LegalTerms of UsePrivacy Policy
  1. Home
  2. Topics

KB13849: How to use Report Builder In MicroStrategy Developer 10.x


Stefan Zepeda

Salesforce Solutions Architect • Strategy


Report Builder is a pre-designed fully prompted report that can be used as a template to assist users in building other reports in MicroStrategy Developer 10.x

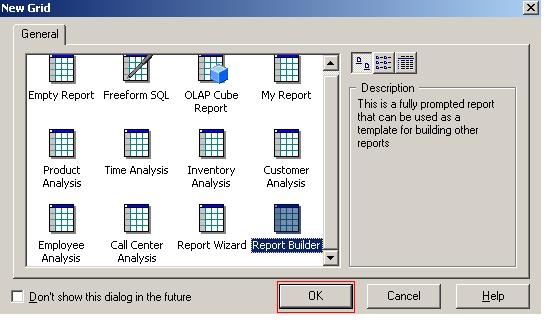
What is Report Builder?
Report Builder is a pre-designed fully prompted report that can be used as a template to assist users in building other reports in Strategy Developer 10.x
 
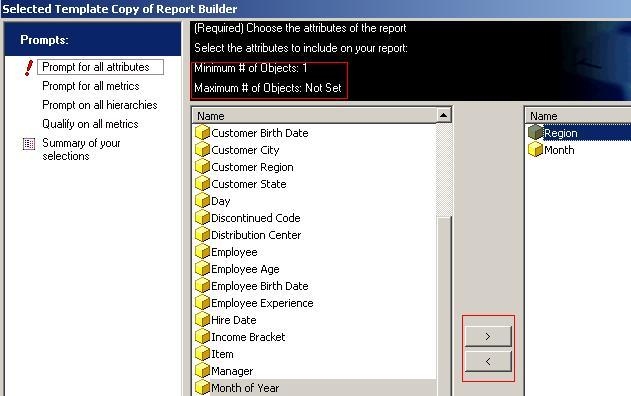
Using Report Builder:
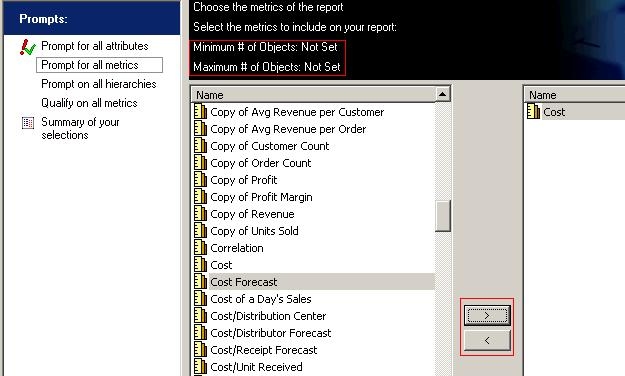
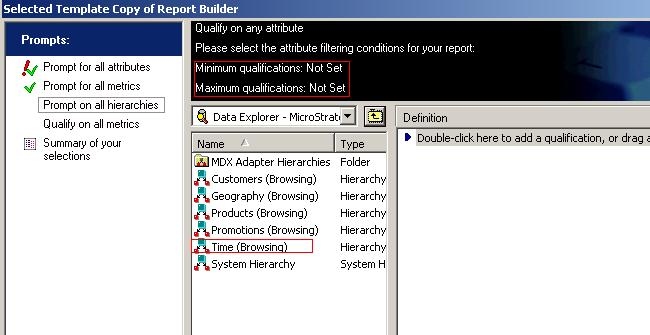
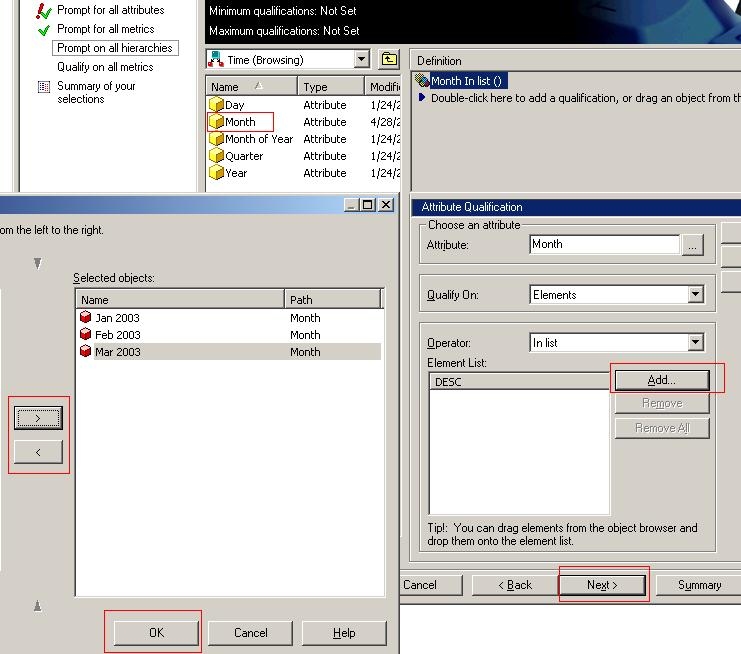
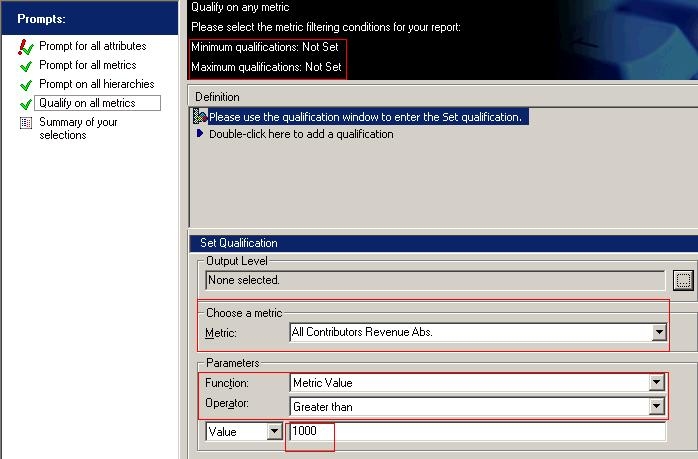
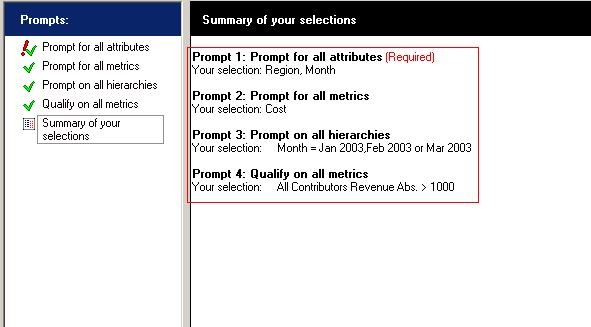
In this example, the user is creating a report to allow users to see the Cost of Regions in which All Contribution Revenue is greater than $1000 for January, February, and March of 2003.
 
The following steps may be use as a reference when building reports with Report Builder:

  • Create a new report in Strategy Developer 10.x and in the New Grid window, select Report Builder and click 'OK', as shown below:
ka02R000000kVg1QAE_0EM440000002FUR.jpeg
  • On the next screen, select the attributes to include on the report by clicking on the right arrow to bring them over, and click 'Next.' Keep in mind the requirement for Minimum and Maximum # of Objects. The user must select at least one attribute from the list of available attributes, as shown below:
ka02R000000kVg1QAE_0EM440000002FUX.jpeg
  • On the next screen, choose the metrics from a list of existing metrics to use for the report if so desired. Click the right arrow to bring them over and click 'Next'. The user is not required to make any selection here, as shown below:
ka02R000000kVg1QAE_0EM440000002FUT.jpeg
  • On the next screen, the user can qualify on any attribute by selecting the attribute filtering conditions. In this example, the Month attribute under the Time (Browsing) Hierarchy is selected. Double-click on the Time (Browsing) Hierarchy and click and drag the Month attribute over to the Definition window, as shown below:
ka02R000000kVg1QAE_0EM440000002FUN.jpeg
  •  
    Click Add to select Jan 2003, Feb 2003, and Mar 2003 elements from Month attribute to qualify on. Select OK then Next, as shown below:
     
ka02R000000kVg1QAE_0EM440000002FUP.jpeg
  • On the next screen, the user can choose to qualify on any available metrics. All Contributions Revenue Abs is selected in this example to display value > 1000, as shown below:
ka02R000000kVg1QAE_0EM440000002FUZ.jpeg
  • On the next screen, verify the selected objects and click Finish to continue to Report Editor, as shown below:
ka02R000000kVg1QAE_0EM440000002FUb.jpeg
  • If further modification to the report is needed, the user can do so in the Report Editor.

Comment

0 comments

Details

Knowledge Article

Published:

May 29, 2017

Last Updated:

May 29, 2017