The following examples demonstrate how Level 1 and Level 2 SQL Global Optimization settings work in Strategy SQL Generation Engine 9.x and 10.x
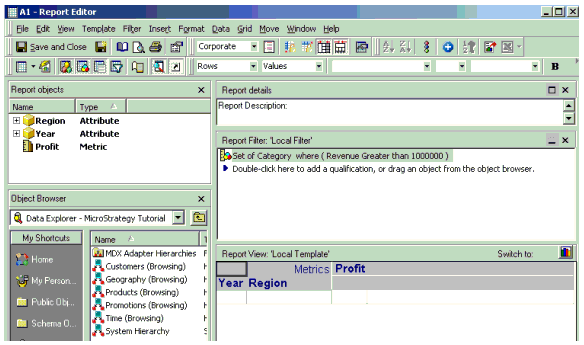
Using the Strategy Tutorial project, create a report with the ‘Year’ and ‘Region’ attributes, and the ‘Profit’ metric in the grid. Create a report filter with a set qualification on the ‘Revenue’ metric and ‘Category’ output, as shown below:
The following SQL is generated:
First Pass:
create table ZZMQ00 (
   CATEGORY_ID BYTE)
 insert into
ZZMQ00
select   a11. AS CATEGORY_ID
from      a11
group by a11.
having   sum(a11.) > 1000000.0
select   a15. AS YEAR_ID,
         a14. AS REGION_ID,
         max(a16.) AS REGION_NAME,
         sum((a11. - a11.)) AS WJXBFS1
from      a11,
          a12,
               pa13,
          a14,
             a15,
            a16
where    a11. = a12. and
         a12. = pa13. and
         a11. = a14. and
         a11. = a15. and
         a14. = a16.
group by a15.,
         a14.
 drop table ZZMQ00
The SQL generated is:
First Pass:
create table ZZMQ00 (
  CATEGORY_ID BYTE)
 insert into ZZMQ00
 select      a11. AS CATEGORY_ID
from         a11
group by    a11.
having      sum(a11.) > 1000000.0
select   a12. AS YEAR_ID,
         a11. AS REGION_ID,
         max(a13.) AS REGION_NAME,
         sum((a11. - a11.)) AS WJXBFS1
from      a11,
          a12,
          a13
where    a11. = a12. and
         a11. = a13.
group by a12.,
         a11.
 drop table ZZMQ00
If the report SQL is generated again, notice that the unused pass has been dropped:
Explicit | Explicit |
| Report: A2 Cache Used: No a11. AS REGION_ID, max(a13.) AS REGION_NAME, sum((a11. - a11.)) AS WJXBFS1 from a11, a12, a13 where a11. = a12. and a11. = a13. group by a12., a11. |
REMOVING DUPLICATE PASSES
Create a report that will have duplicate passes, such as the report shown below:
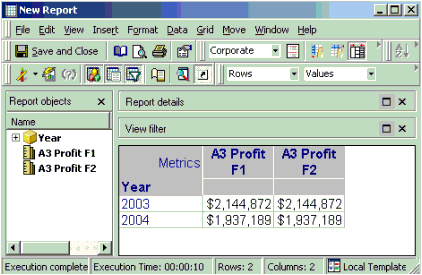
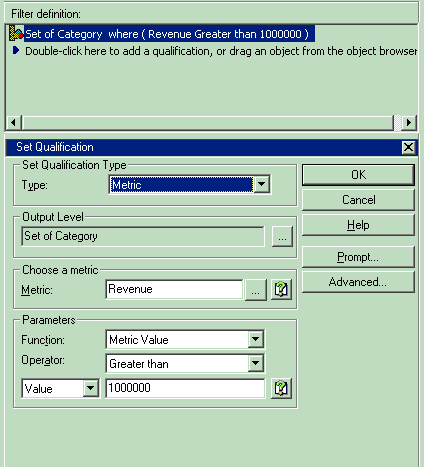
'A3 Profit F1' is the ‘Profit’ metric with Condition F1. F1 is a ‘Set of’ filter on the ‘Revenue’ metric, and the filter has an output level on the attribute ‘Category’, with the operator Greater than 1000000, as shown below:
Create another filter F2 with the same parameters as F1, but do not copy or use the same filter, as the optimization engine will otherwise not generate a duplicate pass. Generate report SQL (see the table below under ‘Without Setting’). Now set the Global Optimization VLDB Property to Remove Duplicate and Unused Passes and execute the report SQL:
a11. | a11. |
create table ZZMQ00 ( CATEGORY_ID BYTE) select a11. AS CATEGORY_ID from a11 group by a11. having sum(a11.) > 1000000.0 CATEGORY_ID BYTE) insert into ZZMQ01 select a11. AS CATEGORY_ID from a11 group by a11. having sum(a11.) > 1000000.0 YEAR_ID SHORT, WJXBFS1 DOUBLE) select a11. AS YEAR_ID, sum((a11. - a11.)) AS WJXBFS1 from a11, pa12 where a11. = pa12. group by a11. create table ZZMD03 ( YEAR_ID SHORT, WJXBFS1 DOUBLE) select a11. AS YEAR_ID, sum((a11. - a11.)) AS WJXBFS1 from a11, pa12 where a11. = pa12. group by a11. select pa11. AS YEAR_ID, pa11. AS WJXBFS1, pa12. AS WJXBFS2 from pa11, pa12 where pa11. = pa12. drop table ZZMQ00 drop table ZZMQ01 drop table ZZMD02 drop table ZZMD03 | Report: A3 with setting Cache Used: No CATEGORY_ID BYTE) select a11. AS CATEGORY_ID from a11 group by a11. having sum(a11.) > 1000000.0 YEAR_ID SHORT, WJXBFS1 DOUBLE) select a11. AS YEAR_ID, sum((a11. - a11.)) AS WJXBFS1 from a11, pa12 where a11. = pa12. group by a11. select pa12. AS YEAR_ID, pa12. AS WJXBFS1 from pa12 |
Notice that two out of the five SQL passes have been dropped.
MERGING PASSES WITH DIFFERENT SELECT
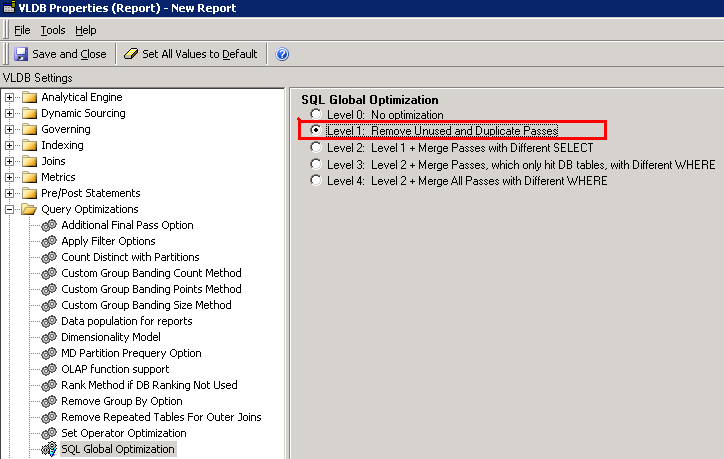
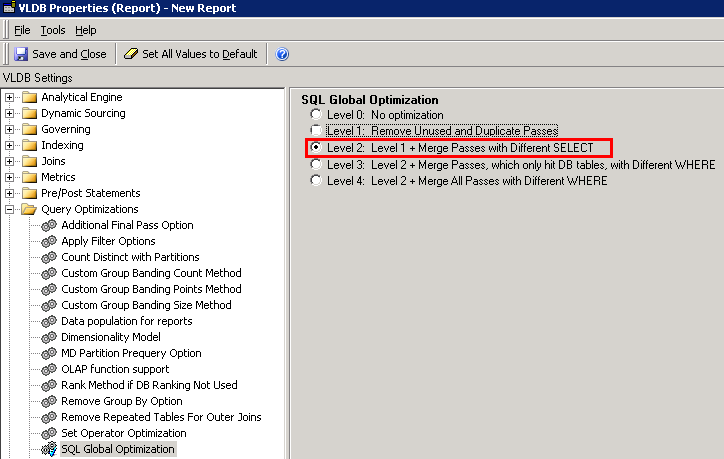
Select the Level e option in the SQL Global Optimization VLDB property to merge passes with different select, as shown below:
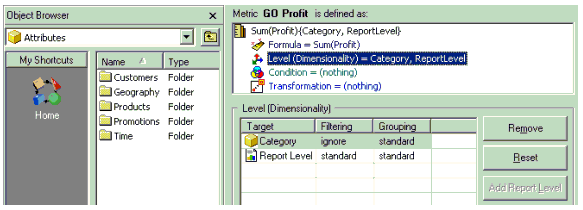
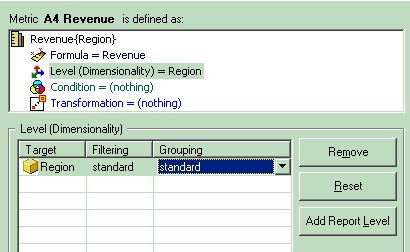
Remove Report Level conditionality from the ‘Revenue’ metric and set Grouping and Filtering to Standard by Region attribute. This will be the 'A4 Revenue’ metric and it will be the total Revenue for each Region, as shown below:
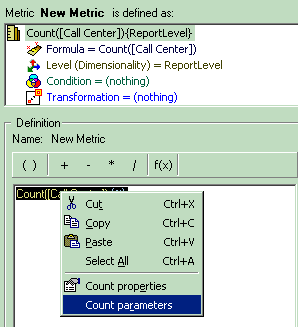
Create a new metric 'A4 Call Center’ count metric with the following formula:
Count() {~}
Highlight the formula in the metric and right-click and select ‘Count parameters’ as shown below:
In the Count Parameters console, set the FactID to Revenue, as shown below:
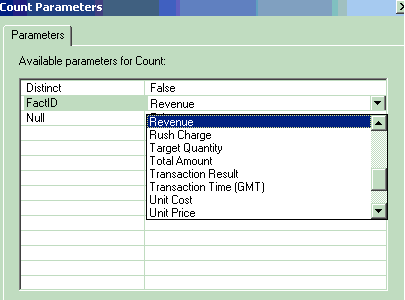
The ‘A4 Call Center’ count metric will be the number of Call Centers for each Region.
Create a compound metric ‘A4 Average Revenue’ that will give the average revenue using the following formula:
(A4 Revenue Metric)/(A4 Call center Count Metric)
Create a report with ‘Region’, ’ A4 Revenue Metric’, and ‘A4 Average Revenue’ in the grid, as shown below:
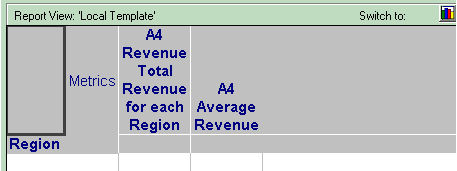
Execute the report and capture the SQL (see the table below under ‘Without Setting’). Now set the 'Merge Passes with Different Select' VLDB Property and execute SQL:
| |
Report: A4 Without setting Cache Used: No create table ZZMD00 ( REGION_ID BYTE, WJXBFS1 DOUBLE) select a12. AS REGION_ID, from a11, a12 where a11. = a12. group by a12. create table ZZMD01 ( REGION_ID BYTE, WJXBFS1 LONG) select a12. AS REGION_ID, from a11, a12 where a11. = a12. group by a12. select pa11. AS REGION_ID, a13. AS REGION_NAME, pa11. AS WJXBFS1, IIF(ISNULL((pa11. / IIF(pa12. = 0, NULL, pa12.))), 0, (pa11. / IIF(pa12. = 0, NULL, pa12.))) AS WJXBFS2 from pa11, pa12, a13 where pa11. = pa12. and pa11. = a13. | Report: A4 With setting Cache Used: No create table ZZMD00 ( REGION_ID BYTE, WJXBFS1 DOUBLE, WJXBFS2 LONG) select a12. AS REGION_ID, count(a11.) AS WJXBFS2 from a11, a12 where a11. = a12. group by a12. select pa12. AS REGION_ID, a13. AS REGION_NAME, pa12. AS WJXBFS1, IIF(ISNULL((pa12. / IIF(pa12. = 0, NULL, pa12.))), 0, (pa12. / IIF(pa12. = 0, NULL, pa12.))) AS WJXBFS2 from pa12, a13 where pa12. = a13. |
