EducationSoftwareStrategy.com
StrategyCommunity

Knowledge Base

Product

Community

Knowledge Base

TopicsBrowse ArticlesDeveloper Zone

Product

Download SoftwareProduct DocumentationSecurity Hub

Education

Tutorial VideosSolution GalleryEducation courses

Community

GuidelinesGrandmastersEvents
x_social-icon_white.svglinkedin_social-icon_white.svg
Strategy logoCommunity

© Strategy Inc. All Rights Reserved.

LegalTerms of UsePrivacy Policy
  1. Home
  2. Topics

KB14000: Pie charts are not being displayed correctly and multiple pies are being shown instead of one in MicroStrategy Web 9.x


Community Admin

• Strategy


In MicroStrategy Web 9.x, when displaying a pie chart, multiple pies are displayed instead of one.

SYMPTOM:
In Strategy Web 9.x, when displaying a pie chart, multiple pies are displayed instead of one.
 
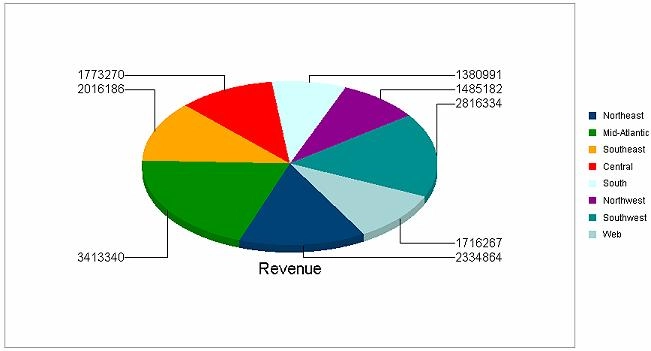
When executing a report with a pie graph in Strategy Developer, it is displayed as shown below:
 

ka04W000000OdQkQAK_0EM4400000028t8.jpeg

 
However, in Strategy Web 9.x, multiple pies are displayed instead of one, as shown below:
 

ka04W000000OdQkQAK_0EM4400000028tC.jpeg

 
CAUSE:
The reason the graph displays differently in Strategy Web 9.x is because the option 'Series by Column' is enabled. Once the option 'Series by Row' is enabled, the graph will look similar to how it displays in Strategy Developer 9.x, as shown below:
 

ka04W000000OdQkQAK_0EM4400000028tE.jpeg

 
ACTION:
Enable the option 'Series by Row'.


Comment

0 comments

Details

Knowledge Article

Published:

June 22, 2017

Last Updated:

June 22, 2017