SYMPTOM:
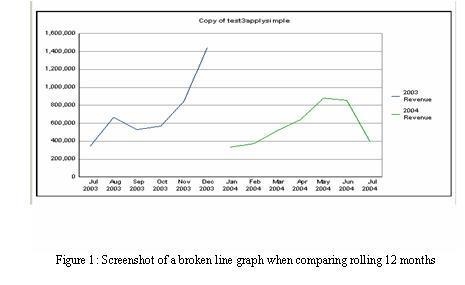
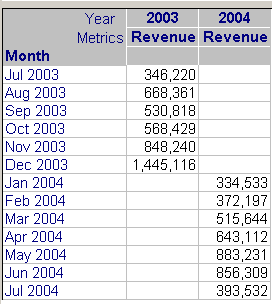
In Strategy Developer 9.4.x - 10.x, users are unable to create a rolling 12 month graph in one single line if the 12 months are split into two separate years with Month in the rows and the Year attribute in the columns.
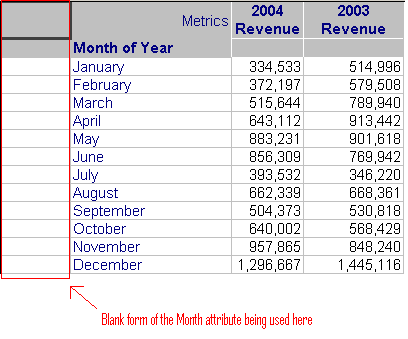
The following figures illustrate what the current behavior is and what users may want to achieve:
STEPS TO REPRODUCE:
Follow the steps below to reproduce this issue using the Strategy Tutorial project:
ACTION:
Follow the steps below to resolve this issue:
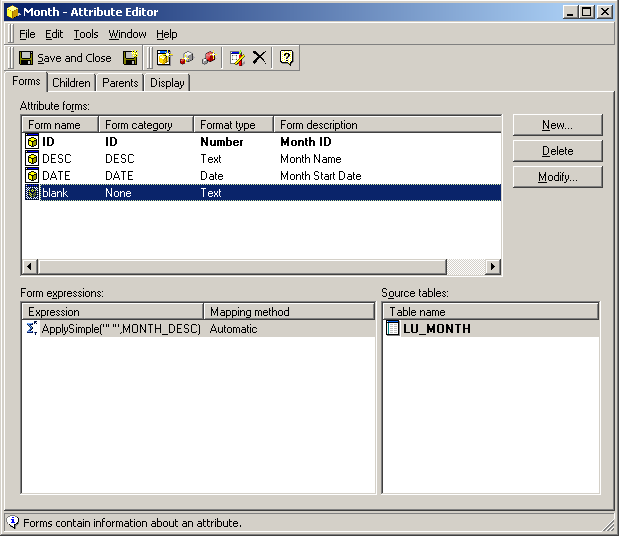
NOTE: An enhancement request has been made to allow users to create a graph for rolling 12 months comparing current and prior year metrics without having to modify attributes by implementing ApplySimple statements. Contact Strategy Technical Support for an update on the status of this request.