EducationSoftwareStrategy.com
StrategyCommunity

Knowledge Base

Product

Community

Knowledge Base

TopicsBrowse ArticlesDeveloper Zone

Product

Download SoftwareProduct DocumentationSecurity Hub

Education

Tutorial VideosSolution GalleryEducation courses

Community

GuidelinesGrandmastersEvents
x_social-icon_white.svglinkedin_social-icon_white.svg
Strategy logoCommunity

© Strategy Inc. All Rights Reserved.

LegalTerms of UsePrivacy Policy
  1. Home
  2. Topics

KB14624: How to enable logging of performance counters using Microsoft Windows XP and 2003 Performance Monitor for MicroStrategy Intelligence Server 9.x and 10.x


Community Admin

• Strategy


How to enable logging of performance counters using Microsoft Windows XP and 2003 Performance Monitor for MicroStrategy Intelligence Server 9.x and 10.x

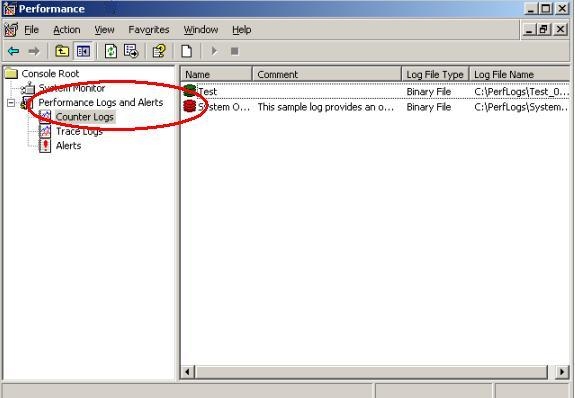
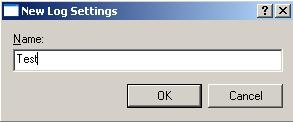
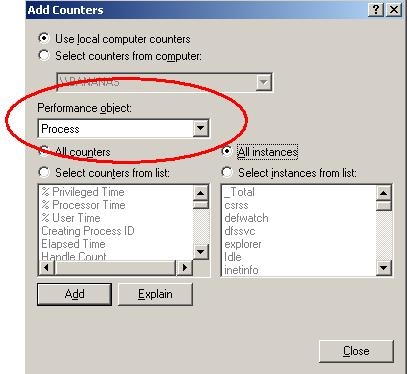
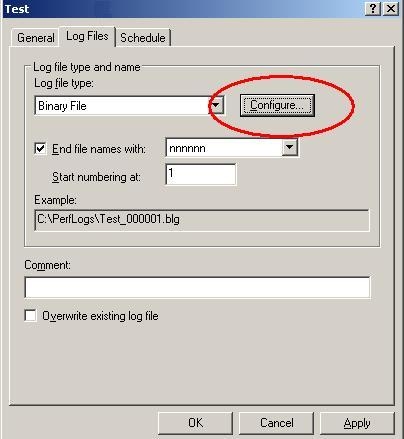
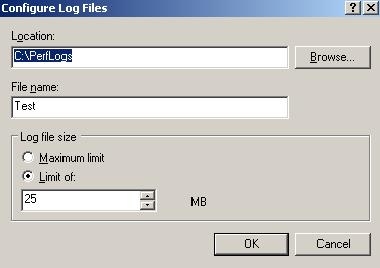
To configure Microsoft Performance Monitor for Microsoft Windows 2003, follow the steps below:
 

  • Open Microsoft Performance Monitor by going to Start -> Programs -> Strategy -> Intelligence Server.
  • Under the left window, go to Performance Logs and Alerts and highlight Counter Logs, as shown below:
ka04W000000OhHGQA0_0EM440000002BaM.jpeg
  • In the right window, right-click and choose New Log Settings to open the following dialog box;
ka04W000000OhHGQA0_0EM440000002BaL.jpeg
  • Type in a name and click OK.
  • Under the General tab, click on Add Counters, as shown below:
ka04W000000OhHGQA0_0EM440000002BaP.jpeg
  • In the drop-down box, choose Process, as shown below:
ka04W000000OhHGQA0_0EM440000002BaR.jpeg
  • Select the radio buttons for 'All counters' and 'All instances'. By including all counters and all instances, this will allow users to take a look at the machine as a whole and see if there are any application conflicts in regards to memory. Additionally, most database Instances in Strategy are set up to run in multi-Process mode. This spawns a new executable for each and every active database connection. Without all counters and all Instances selected, these processes will not be recorded as they are spawned and killed.
  • Click on Add.
  • Repeat this process for the Performance objects Memory, Strategy Server Jobs, and Strategy Server Users.
  • Once all have been added, click on OK.
  • Under the General tab, change the Interval to 30 seconds. This will give enough granularity without capturing too much data.
  • Go the Log files tab and click on Configure, as shown below:
ka04W000000OhHGQA0_0EM440000002BaO.jpeg
  • Check the location where the files will be stored and set the log file size limit to a number around 25 MB, as shown in the image below. This will keep give enough data in a single file to be useful without interfering with system performance. This number may need to be lowered if the machine is under stress or underpowered.
ka04W000000OhHGQA0_0EM440000002BaN.jpeg
  • Click OK.
  • Click OK to close the window.
  • Right-click on icon for the new log settings and select start.

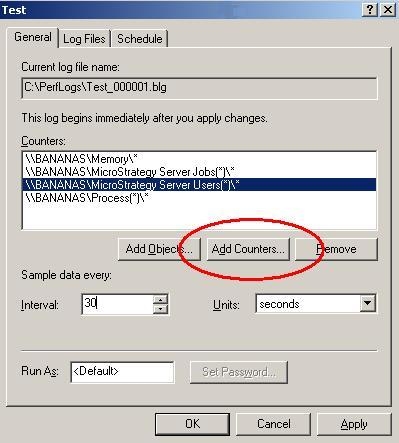
When monitoring Strategy Intelligence Server 9.x for memory, users should capture the data from re-start of the service through to the issue. This will show how memory is used over time.


Comment

0 comments

Details

Knowledge Article

Published:

May 27, 2017

Last Updated:

May 27, 2017