EducationSoftwareStrategy.com
StrategyCommunity

Knowledge Base

Product

Community

Knowledge Base

TopicsBrowse ArticlesDeveloper Zone

Product

Download SoftwareProduct DocumentationSecurity Hub

Education

Tutorial VideosSolution GalleryEducation courses

Community

GuidelinesGrandmastersEvents
x_social-icon_white.svglinkedin_social-icon_white.svg
Strategy logoCommunity

© Strategy Inc. All Rights Reserved.

LegalTerms of UsePrivacy Policy
  1. Home
  2. Topics

KB14940: Drilling produces different results in grid and graph reports in MicroStrategy Developer 9.4.1 and 10.x


Stefan Zepeda

Salesforce Solutions Architect • Strategy


Drilling produces different results in grid and graph reports in MicroStrategy Developer 9.4.1 and 10.x

SYMPTOM
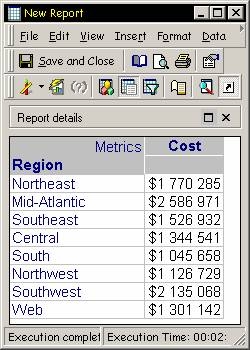
A user creates a report with the Region attribute and Cost metric, as shown below:
ka02R000000kX1iQAE_0EM440000002FMC.jpeg

 
When the user drills on Southeast -> Down -> Call center, the results show Atlanta and Miami as the Call Centers, as shown below:

ka02R000000kX1iQAE_0EM440000002FMB.jpeg

 
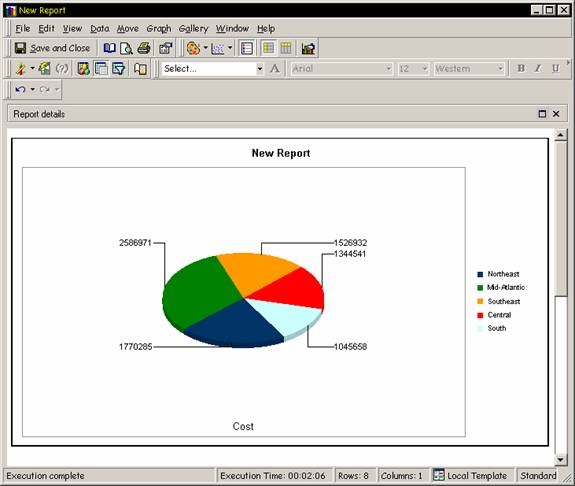
The original report is viewed in graph mode, as shown below:
ka02R000000kX1iQAE_0EM440000002FM9.jpeg

 
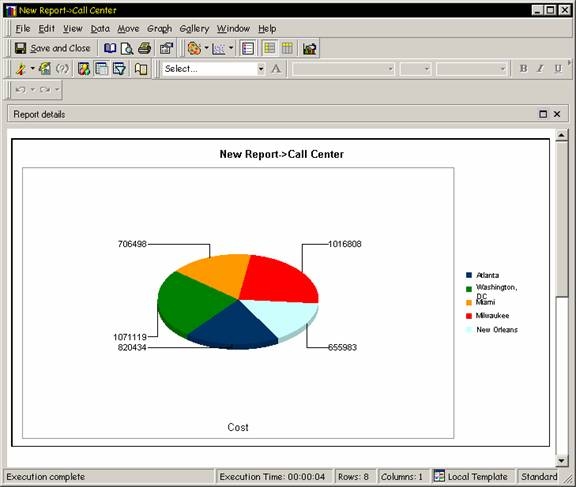
When performing the same drill, the results are different and show all Call Centers, as shown below:
ka02R000000kX1iQAE_0EM440000002FM7.jpeg

 
CAUSE
This is a known issue in Strategy Developer 94.1 and 10.X
 
ACTION
Contact Strategy Technical Support for an update on the status of this issue.


Comment

0 comments

Details

Knowledge Article

Published:

April 11, 2017

Last Updated:

April 11, 2017