EducationSoftwareStrategy.com
StrategyCommunity

Knowledge Base

Product

Community

Knowledge Base

TopicsBrowse ArticlesDeveloper Zone

Product

Download SoftwareProduct DocumentationSecurity Hub

Education

Tutorial VideosSolution GalleryEducation courses

Community

GuidelinesGrandmastersEvents
x_social-icon_white.svglinkedin_social-icon_white.svg
Strategy logoCommunity

© Strategy Inc. All Rights Reserved.

LegalTerms of UsePrivacy Policy
  1. Home
  2. Topics

KB15062: Unable to specify separate line styles for each needle on a gauge graph in MicroStrategy Developer


Stefan Zepeda

Salesforce Solutions Architect • Strategy


When there is more than one needle on a gauge graph in MicroStrategy Developer, the user is unable to specify separate line styles for each needle. Users should utilize the 'Fill' tab and apply a pattern or a picture to each individual needle.

SYMPTOM:
 
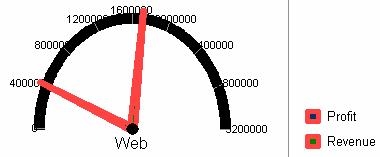
When there is more than one needle on a gauge graph in Strategy Developer, the user is unable to specify separate line styles for each needle.
 
STEPS TO REPRODUCE:
 
Follow the steps below to reproduce this issue in the Strategy Tutorial project:
  • Create a report with the 'Region' attribute and the metrics 'Profit' and 'Revenue.'
  • Execute the report as a graph, choosing the Gauge Graph (Advanced > Gauge > Gauge Graph.)
  • If necessary, show the second metric's needle (right-click on the data point, choose 'Graph Options,' and uncheck 'Hide Marker Needle.')
  • Right-click on one needle (or the legend marker) and select 'Format Gauge Needle' (or 'Format Legend Marker.')
  • Select the Line tab and choose a 4pt thickness, solid, red line.
  • Click OK, and notice that the line style has now been applied to both needles, as shown below:
ka02R000000kbx6QAA_0EM440000002FLi.jpeg

CAUSE:
 
This is a known issue in Strategy Developer.
 
WORKAROUND:
 
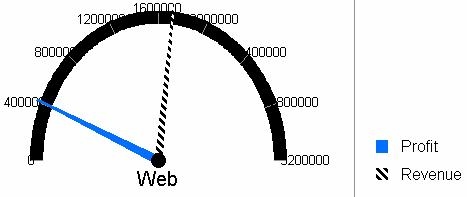
Instead of using Line style to customize the needle, utilize the 'Fill' tab and apply a pattern or a picture to each individual needle:
  • Create a gauge graph with two needles, as described above.
  • Right-click on the data label for one metric and select 'Format Legend Marker.'
  • Change the Line tab settings to transparent and click Apply.
  • Select the 'Fill' tab.
  • Click the 'Pattern' button.
  • Change the foreground color to white.
  • Change the background color to black.
  • In the main window, select the Row 4 Column 5 pattern (angled bricks, or similar).
  • Click OK twice.
  • Format the second data label to a solid color (blue) with the line tab set to transparent.
  • The needles are now different colors, as shown below:
ka02R000000kbx6QAA_0EM440000002FLk.jpeg

Comment

0 comments

Details

Knowledge Article

Published:

June 5, 2017

Last Updated:

June 5, 2017