SYMPTOM
A specific derived metric created in a Report Services Document does not aggregate to a grouping level when it is used in the header or footer of a grouping section in Strategy Intelligence Server. Other derived metrics aggregate as expected, but some of them do not.
For example, consider a Report Services document constructed as follows. The document uses one data set report, which returns the sales revenue per region, along with the average of the regional revenue across all regions.

The document uses the Country attribute as a grouping section, and defines the following derived metrics:
The document is constructed with the following design:
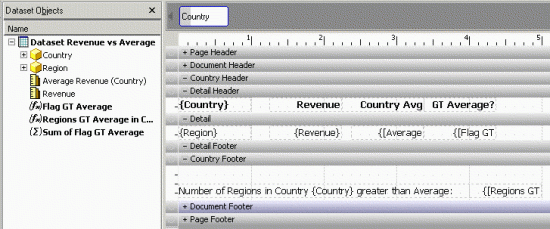
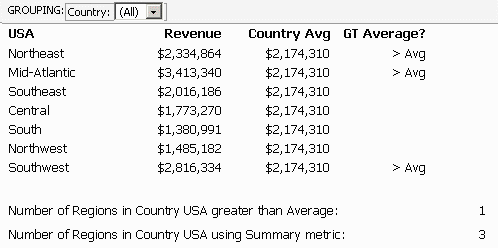
When the second derived metric is used in the Country grouping section, it is expected that the total count will be displayed. But, the displayed value is 1, even though three regions meet the qualification.
NOTE: Conditional formatting is used in this document to display descriptive text instead of the number 1 for the flag metric.

CAUSE
Metrics used in a grouping section header or footer depend on the metric's dynamic aggregation function to aggregate to the desired level. The derived metric editor does not expose the dynamic aggregation function; therefore, it is set to default.
When the dynamic aggregation function is "default," the Analytical Engine must look to the metric used within the derived metric to determine which aggregation function to use. If the inner metric is the Sum of another metric, then the enclosing derived metric will use the Sum function to aggregate to the grouping level.
In this example, the inner metric uses a non-aggregating function, IF, to evaluate the region's status relative to the average. As a result, the dynamic aggregation up to the grouping level of Country also does not aggregate and the base value of 1 is displayed.
Not all functions are supported for default dynamic aggregation in the Report Services document. Sum, Maximum and Minimum are expected to aggregate in every case. Other aggregation functions may fail to aggregate depending on the source data and the document design.
ACTION
If a summary metric is used to count the number of regions with greater than average revenue, the aggregation behaves as expected. A summary metric stores its own aggregation function within its definition, and the aggregation function may be chosen by the user.

The summary metric will return the expected value of 3, whereas the derived metric does not.