SYMPTOM:
Expected result rows for one or more metrics on a report are missing when the following conditions are met:
Consult the following Strategy Knowledge Base article for an example of the construction of a nested metric:
KB5353 - How to create a metric using a nested aggregation in Strategy
For instance, compare the metric results in the following report from the Strategy Tutorial project.
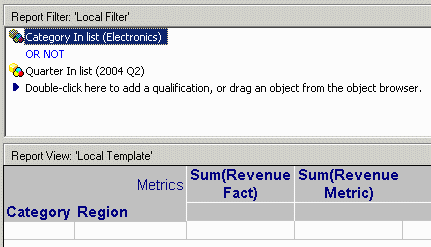
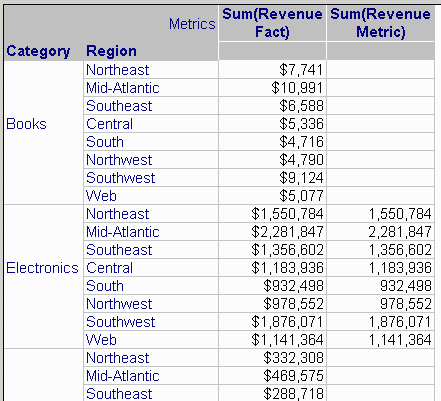
Based on this filter definition, users would expect the report to return data from all Quarters for the Electronics Category, and for Categories other than Electronics, data from all Quarters except 2004 Q2. The metric based on the Revenue fact returns exactly this result; however, a metric taking the sum of the Revenue metric returns data only for the Electronics category, as shown below
CAUSE:
The Sum(Revenue Metric) applies the report filter at two different levels of aggregation:
This can be seen in the report's SQL:
select a14.REGION_ID REGION_ID,
a12.CATEGORY_ID CATEGORY_ID,
sum(a11.TOT_DOLLAR_SALES) WJXBFS1
into #ZZTQR01005KMD000
from SUBCATEG_MNTH_CTR_SLS a11
join LU_SUBCATEG a12
on (a11.SUBCAT_ID = a12.SUBCAT_ID)
join LU_MONTH a13
on (a11.MONTH_ID = a13.MONTH_ID)
join LU_CALL_CTR a14
on (a11.CALL_CTR_ID = a14.CALL_CTR_ID)
where (a12.CATEGORY_ID in (2)
or (not a13.QUARTER_ID in (20042)))
group by a14.REGION_ID,
a12.CATEGORY_ID
select pa11.REGION_ID REGION_ID,
pa11.CATEGORY_ID CATEGORY_ID,
pa11.WJXBFS1 WJXBFS1
into #ZZTQR01005KMD001
from #ZZTQR01005KMD000 pa11
where pa11.CATEGORY_ID in (2)
select coalesce(pa11.CATEGORY_ID, pa12.CATEGORY_ID) CATEGORY_ID,
a13.CATEGORY_DESC CATEGORY_DESC,
coalesce(pa11.REGION_ID, pa12.REGION_ID) REGION_ID,
a14.REGION_NAME REGION_NAME,
pa11.WJXBFS1 WJXBFS1,
pa12.WJXBFS1 WJXBFS2
from #ZZTQR01005KMD000 pa11
full outer join #ZZTQR01005KMD001 pa12
on (pa11.CATEGORY_ID = pa12.CATEGORY_ID and
pa11.REGION_ID = pa12.REGION_ID)
join LU_CATEGORY a13
on (coalesce(pa11.CATEGORY_ID, pa12.CATEGORY_ID) = a13.CATEGORY_ID)
join LU_REGION a14
on (coalesce(pa11.REGION_ID, pa12.REGION_ID) = a14.REGION_ID)
This behavior holds true in general, but is not expected to affect the majority of report results because filter qualifications on unrelated attributes are most commonly intersected using AND, rather than unioned via OR. When the logical operator is AND, the partial filter application in the second level of aggregation makes no difference to the end result because the rows that were lost in the example above (in the second pass) are dropped in the first pass as a result of the intersection.
OR retains some rows in the first pass that meet one qualification, but not the other. In this case, when one or the other qualification is omitted, rows meeting that qualification only will be omitted from the metric result. Therefore, this problem can affect only OR filters.
The problem will also not occur if the dimensionality of the inner level of aggregation includes all the attributes required for the filter. In this example, the Quarter qualification is dropped only because that attribute is not available in the intermediate table for the inner metric results.
ACTION:
In current versions of Strategy, two solutions are possible. Only one needs to be applied.
Option 1:
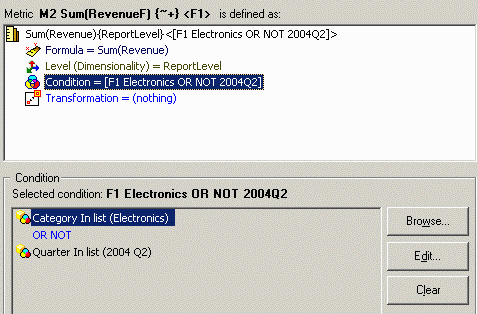
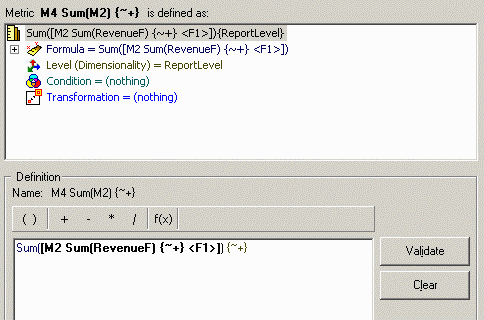
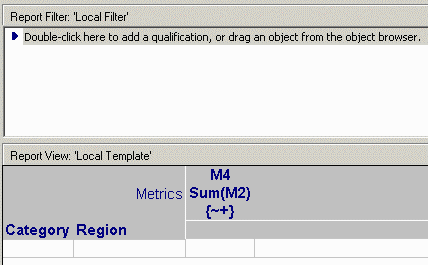
Apply the filter as a condition only in the inner metric, and omit it from the outer metric's conditionality as well as from the report filter. Based on the object definitions, then, the filter must be used in the first pass but will not appear in the second pass (because it isn't present in the definition of the outer layer of aggregation).
The following illustrations demonstrate how this technique can be applied to the above example.
Inner metric:
Outer metric:
Report definition:
Report SQL:
select a14.REGION_ID REGION_ID,
a12.CATEGORY_ID CATEGORY_ID,
sum(a11.TOT_DOLLAR_SALES) WJXBFS1
into #ZZTQR01008TMD000
from SUBCATEG_MNTH_CTR_SLS a11
join LU_SUBCATEG a12
on (a11.SUBCAT_ID = a12.SUBCAT_ID)
join LU_MONTH a13
on (a11.MONTH_ID = a13.MONTH_ID)
join LU_CALL_CTR a14
on (a11.CALL_CTR_ID = a14.CALL_CTR_ID)
where (a12.CATEGORY_ID in (2)
or (not a13.QUARTER_ID in (20042)))
group by a14.REGION_ID,
a12.CATEGORY_ID
select pa11.CATEGORY_ID CATEGORY_ID,
a12.CATEGORY_DESC CATEGORY_DESC,
pa11.REGION_ID REGION_ID,
a13.REGION_NAME REGION_NAME,
pa11.WJXBFS1 WJXBFS1
from #ZZTQR01008TMD000 pa11
join LU_CATEGORY a12
on (pa11.CATEGORY_ID = a12.CATEGORY_ID)
join LU_REGION a13
on (pa11.REGION_ID = a13.REGION_ID)
Option 2:
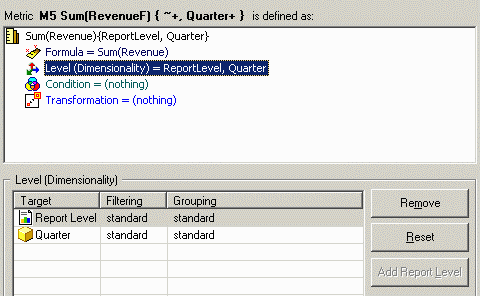
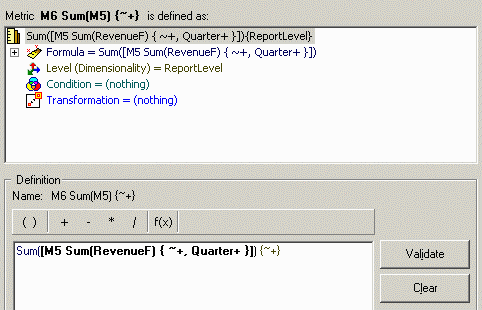
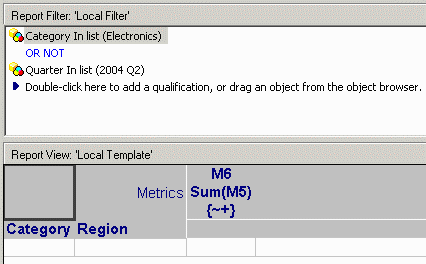
Set the dimensionality of the inner metric so that it includes all of the attributes used in the report filter. All of the qualifications, with the correct conjunctions, will be preserved in the second pass. Since the first and second pass filters will be identical, they will cover the same rows.
This may not be a viable workaround if the outer function is not associative. A sum of a sum works because addition is associative: ((a + b + c + d) + (e + f + g)) = ((a + b) + c + d + (e + f) + g). An average of a sum does not have this property; changing the dimensionality of the inner sum will change the input to the average function and produce different results. This approach should be used, then, with caution.
Inner metric:
Outer metric:
Report definition:
Report SQL:
select a14.REGION_ID REGION_ID,
a13.QUARTER_ID QUARTER_ID,
a12.CATEGORY_ID CATEGORY_ID,
sum(a11.TOT_DOLLAR_SALES) WJXBFS1
into #ZZTQR0100BCMD000
from SUBCATEG_MNTH_CTR_SLS a11
join LU_SUBCATEG a12
on (a11.SUBCAT_ID = a12.SUBCAT_ID)
join LU_MONTH a13
on (a11.MONTH_ID = a13.MONTH_ID)
join LU_CALL_CTR a14
on (a11.CALL_CTR_ID = a14.CALL_CTR_ID)
where (a12.CATEGORY_ID in (2)
or (not a13.QUARTER_ID in (20042)))
group by a14.REGION_ID,
a13.QUARTER_ID,
a12.CATEGORY_ID
Pass1 - Duration: 0:00:00.04
select pa11.CATEGORY_ID CATEGORY_ID,
max(a12.CATEGORY_DESC) CATEGORY_DESC,
pa11.REGION_ID REGION_ID,
max(a13.REGION_NAME) REGION_NAME,
sum(pa11.WJXBFS1) WJXBFS1
from #ZZTQR0100BCMD000 pa11
join LU_CATEGORY a12
on (pa11.CATEGORY_ID = a12.CATEGORY_ID)
join LU_REGION a13
on (pa11.REGION_ID = a13.REGION_ID)
where (pa11.CATEGORY_ID in (2)
or (not pa11.QUARTER_ID in (20042)))
group by pa11.CATEGORY_ID,
pa11.REGION_ID
