EducationSoftwareStrategy.com
StrategyCommunity

Knowledge Base

Product

Community

Knowledge Base

TopicsBrowse ArticlesDeveloper Zone

Product

Download SoftwareProduct DocumentationSecurity Hub

Education

Tutorial VideosSolution GalleryEducation courses

Community

GuidelinesGrandmastersEvents
x_social-icon_white.svglinkedin_social-icon_white.svg
Strategy logoCommunity

© Strategy Inc. All Rights Reserved.

LegalTerms of UsePrivacy Policy
  1. Home
  2. Topics

KB15552: How to display the right border of the last metric when creating a report or an autostyle with attributes in the row axis and one attribute on top of metrics in the column axis in MicroStrategy Developer


Stefan Zepeda

Salesforce Solutions Architect • Strategy


When creating a report or an autostyle with attributes in the row axis and an attribute on top of metrics in the column axis, the right border of last metric per attribute element disappears in MicroStrategy Developer.

SYMPTOM:
When creating a report or an autostyle with attributes in the row axis and an attribute on top of metrics in the column axis, the right border of last metric per attribute element disappears in Strategy Developer.
 
STEPS TO REPRODUCE:
Follow the steps below to reproduce this issue in the Strategy Tutorial project:
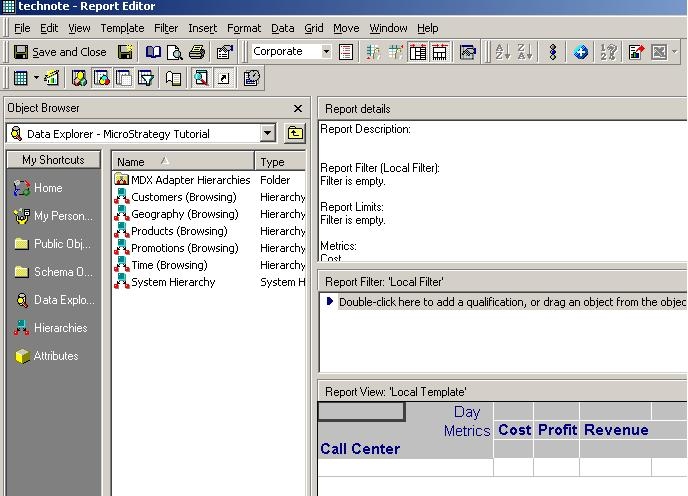
 

  • Create an autostyle by creating a new report.
  • Add the 'Call Center' attribute to the rows and the 'Day' attribute to the columns.
  • Now, add the 'Cost', 'Profit' and 'Revenue' metrics (make 'Revenue' the last metric in the grid) to the columns axis. Make sure the 'Day' attribute is on top of the metrics, as shown below:
ka02R000000kVrPQAU_0EM440000002FIT.jpeg
  • Execute the report.
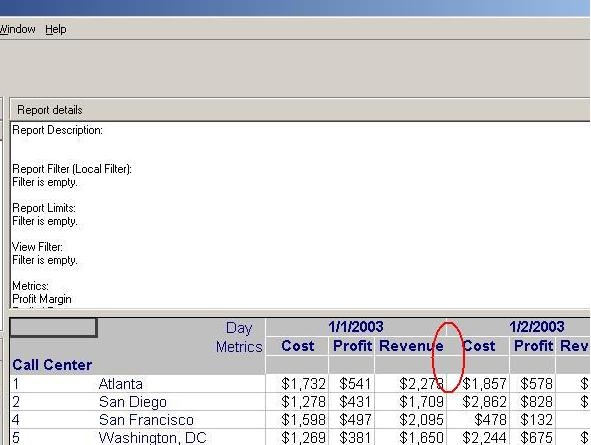
  • Even without formatting the headers values background and borders, the 'Revenue' metric's right side border disappears for each day, as shown below:
ka02R000000kVrPQAU_0EM440000002FIf.jpeg
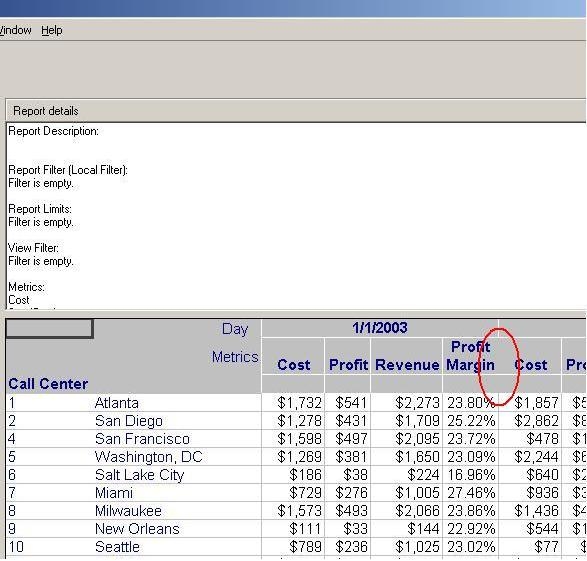
  • Now try to add the 'Profit Margin' metric to the right of 'Revenue'. The right border for the new metric disappears, as shown below:
ka02R000000kVrPQAU_0EM440000002FIZ.jpeg
  • Save the report.
  • If creating an autostyle, save the autostyle by going to Grid > Save Autostyle As.

NOTE: This issue only occurs in Strategy Developer. When going to Strategy Web and executing the report, all the borders for all the metrics appear, as shown below:
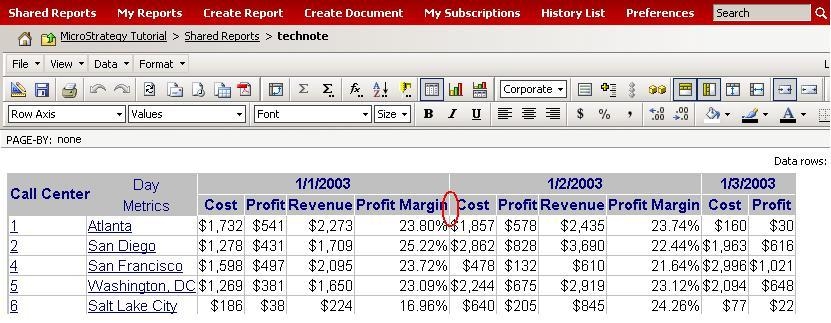
 

ka02R000000kVrPQAU_0EM440000002FIW.jpeg

 
CAUSE:
This is a known issue in Strategy Developer.
 
ACTION:
Strategy will continue to investigate and post updates as soon as they are available.
 
WORKAROUND:
To display all the borders for the 'Profit Margin', follow the steps below:
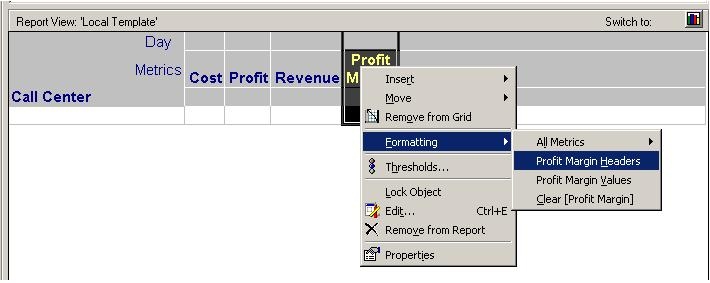
 

  • Open the report created above in step six in edit mode.
  • Highlight and right-click the metric 'Profit Margin'. Select Formatting > Profit Margin Headers, as shown below:
ka02R000000kVrPQAU_0EM440000002FIh.jpeg
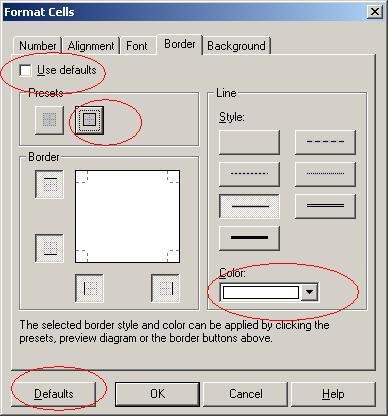
  • Go to the Borders tab. At the bottom of the window click on the 'Defaults' button. When prompted to reset all options to defaults, click OK.
  • Uncheck the box 'Use defaults', change the color to white, and under the 'Preset' section click on the button for the four borders and click OK, as shown below:
ka02R000000kVrPQAU_0EM440000002FIl.jpeg
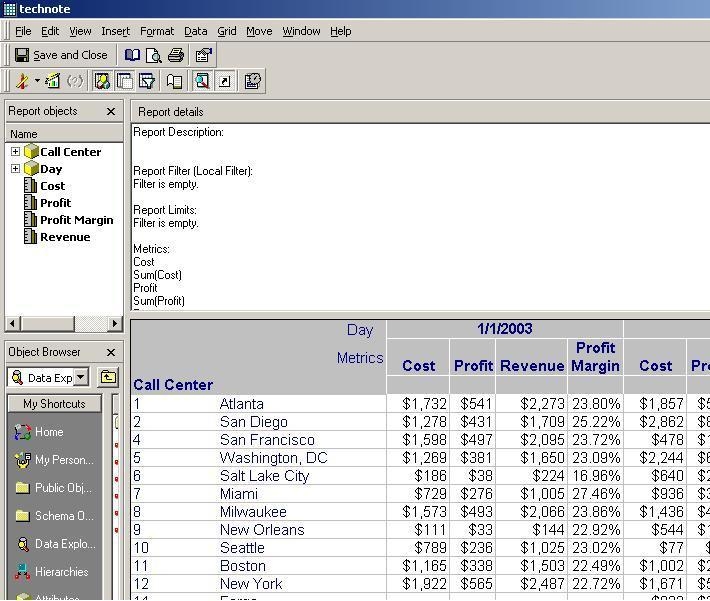
  • Execute the report and see how metric 'Profit Margin' borders are displayed, as shown below:
ka02R000000kVrPQAU_0EM440000002FIc.jpeg
  • If creating an autostyle, save it by going to Grid > Save Autostyle As.

Comment

0 comments

Details

Knowledge Article

Published:

May 19, 2017

Last Updated:

May 19, 2017