A number of situations exist when data may need to be aggregated at different levels in the same query -- for instance, taking an average at the level of a parent attribute over data previously aggregated at the level of one of that attribute's children. A metric to show the per-year average of quarterly totals must first aggregate the basic fact data at the level of quarter, then calculate the average at year level over that intermediate result.
When using MDX Cube data sources, aggregation at multiple levels can be performed in two ways in Strategy Engine.
This article describes the first approach. For custom MDX expressions, consult the following Strategy Knowledge Base article:
KB16406: How to perform multi-level aggregation in custom MDX expressions for MDX Cube data sources in Strategy Engine
For details on the creation of MDX Cube compound metrics, consult the following Strategy Knowledge Base article:
KB15870: New feature in Strategy Developer: Compound metrics for MDX Cube data sources
Important: Most MDX Cube providers include functionality to create the analogue of Strategy derived metrics, such as SAP's Calculated Key Figures or Microsoft Analysis Services' Calculated Members. In some cases, it may be preferable to define multi-level calculations as cube objects, rather than as metrics in Strategy.
MDX is very strict about the way a calculation must be written depending on reporting context, specifically, the relationships among template attributes, filtering attributes and the desired pre-aggregation level). A metric formula that is correct for one report may yield invalid results in a different report. Thus, custom MDX metrics built in Strategy may not be ideal for ad-hoc reporting. In ad-hoc environments, calculated members or key figures are likely a better choice.
Summary metric aggregation in the Analytical Engine
Using the OLAP Services derived metrics feature, or using smart compound metrics (which do not require OLAP Services), metric values at report level retrieved from the MDX Cube may be further aggregated to higher levels.
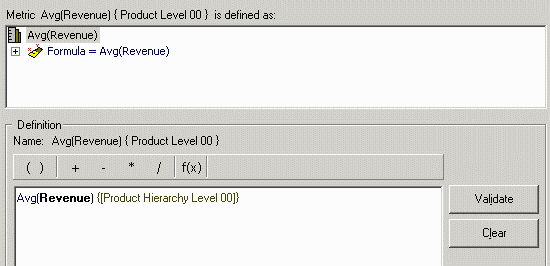
For example, the following compound metrics defined in an MDX Cube instructs the Analytical Engine to take the average of the report-level revenue metric values, rolling the results up to Product Hierarchy Level 00. (In this cube, Product Hierarchy Level 00 corresponds to the Strategy Tutorial Category attribute; Product Hierarchy Level 01 corresponds to Subcategory.) In the metric formula, the desired output dimensionality is given by listing the attribute levels in curly braces { }.
The report results show the correct average, at Category level, over Subcategories.
The report's MDX view shows that the average metric is being evaluated in the Analytical Engine.
Pass0 - Duration: 0:00:02.21
with set [dim0_select_members] as '{[SUB_CAT2 PRODUCT].[LEVEL00].members, [SUB_CAT2 PRODUCT].[LEVEL01].members}'
select {[Measures].[45FQHOI4TISN7TMK0B89GNYW4]} on columns,
non empty hierarchize({[dim0_select_members]}) on rows
from [QE_HIER_2/HJHQHIER]
[Analytical engine calculation steps:
1. Calculate metric: <Avg(Revenue) { Product Level 00 }>
2. Perform cross-tabbing
]
Notes:

The smart metric option is enabled by default for MDX Cube compound metrics not involving custom MDX expressions.