A number of situations exist when data may need to be aggregated at different levels in the same query -- for instance, taking an average at the level of a parent attribute over data previously aggregated at the level of one of that attribute's children. A metric to show the per-year average of quarterly totals must first aggregate the basic fact data at the level of quarter, then calculate the average at year level over that intermediate result.
When using OLAP Cube data sources, aggregation at multiple levels can be performed in two ways
This document describes the second approach. For Analytical Engine evaluation, consult the following Strategy Technical Note:
KB16402 (KB5200-810-2354): How to use smart compound metrics to aggregate report-level metric values at a higher level in OLAP Cube data sources in Strategy Engine 8.1.0
For details on the creation of OLAP Cube compound metrics, consult the following Strategy Technical Note:
KB15870 (KB5700-81x-2493): New feature in Strategy Desktop 8.1.0: Compound metrics for OLAP Cube data sources
Important: Most OLAP Cube providers include functionality to create the analogue of Strategy derived metrics, such as SAP's Calculated Key Figures or Microsoft Analysis Services's Calculated Members. In some cases, it may be preferable to define multi-level calculations as cube objects, rather than as metrics in Strategy.
MDX is very strict about the way a calculation must be written depending on reporting context, specifically, the relationships among template attributes, filtering attributes and the desired pre-aggregation level). A metric formula that is correct for one report may yield invalid results in a different report. Thus, custom MDX metrics built in Strategy may not be ideal for ad-hoc reporting. In ad-hoc environments, calculated members or key figures are likely a better choice.
Aggregation in MDX of values below template level
As with most types of custom MDX metric expressions, the required syntax is different depending on the relationship between the attributes used on the template and the attribute in the custom expression. In the context of multiple levels of aggregation, two scenarios must be considered. In both, the higher-level attribute should be on the template.
The higher and lower level attributes are members of the same hierarchy
In the example above, Category and Subcategory are represented by attributes from the same hierarchy, Product Hierarchy Level 00 and Product Hierarchy Level 01 respectively. If a user wishes to construct a report to display Categories along with the average of Subcategory data for each category, the following MDX expression may be used.
ApplySimple("Avg(Descendants(.CurrentMember, .), #0)", Revenue)
Because Product Hierarchy Level 00 is on the template, the expression ".CurrentMember" evaluates to one member of that level (that is, a Category attribute element). The Descendants function obtains the Level 01 members that belong to the corresponding Level 00 element. For the final calculation, Revenue values are obtained for each of the descendents of the given category, then the average of those values is taken and returned for that category.
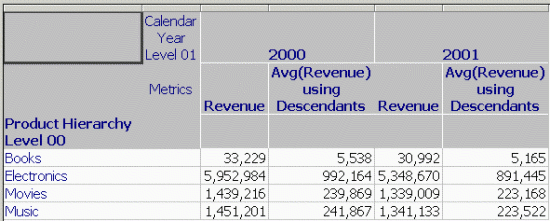
For this expression to return correct results, the template must contain Product Hierarchy Level 01 (the attribute given as the second argument to Descendants) or one of its parents (Level 00). If the same attribute from the descendents function is on the template, the average will be taken of one value only, which matches the behavior of nested aggregation in the SQL report when the aggregation levels of the nested metrics are the same.
If no attribute from the hierarchy is on the template, the CurrentMember function will be empty for every row and that metric will always have an empty result. For instance, if Region Level 01 were on the template but the average were to be taken over Subcategory, the metric would not return data. But this reporting scenario, the higher-level attribute (on the template) is not in the same dimension* as the lower-level attribute, so the above formula does not apply. The following section describes how to handle that case.
MSTR_MEM_CACHE_MAX_BLOCK_SIZE = 32 MB | MSTR_MEM_CACHE_MAX_BLOCK_SIZE = 32 MB | MSTR_MEM_CACHE_MAX_BLOCK_SIZE = 32 MB |
The higher and lower level attributes belong to different dimensions
In this situation, instead of computing the average over the set returned by the descendents function, the set is given explicitly.
Here, Quarter-level data will be averaged and presented at the level of Region.
If all Quarters should be considered, use the expression:
ApplySimple("Avg(..Members, #0)", Revenue)
The set expression ..Members simply returns all the members of the Calendar Quarter dimension for level 01. In the report results, the average in each row is, as expected for two years' worth of data, 1/8th of the Sum value reported by the normal Revenue metric.

The .Members expression above returns all members of that hierarchy level, even if there is a report filter on Calendar Quarter Level 01. (This is useful if metrics need to be constructed to ignore filtering qualifications present in the report filter.) If the custom metric should respect the report filter qualification, then the element set from that qualification should be written into the metric formula.
For example, if only Q1 2001 and Q2 2001 should be included in the calculation, then the expression should list the desired elements in a tuple with curly braces { }:
ApplySimple("Avg({., .}, #0)", Revenue)
If the elements are hardcoded, as here, then the metric must be edited when the report filter is changed. This can be alleviated by using the same prompt in the metric as in the report filter.
Here, a standalone prompt has been created for a list of elements of the Calendar Quarter Level 01 attribute. It is embedded in the custom MDX metric formula using ApplySimple:
ApplySimple("Avg({#0}, #1)", ?, Revenue)
The same prompt is used in the report filter:
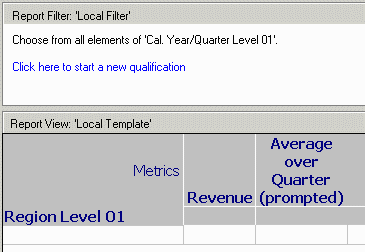
Because there is only one prompt object, the user is as the prompt question only once. When the prompt is answered with the desired two elements, the average result is half the sum (which is correct for two elements chosen in the prompt).

Calculating a further aggregation higher than template level in MDX
In the Product hierarchy example above, the descendents function was used to instruct the OLAP Cube database to navigate downward in the hierarchy tree, obtain the metric values for the lower level, then do additional aggregation at report level. If the formula instead calls for aggregation over the siblings of the current member (where the current member is report level), then report level metric values will be aggregated to a higher level.
The following charts compare the two processes:


In MDX, the latter case can be written using the following Strategy metric formula:
ApplySimple("Avg({Descendants(Ancestor(.CurrentMember, .), .)}, #0)", Revenue)
Due to variability in the way different OLAP Cube providers evaluate MDX, it is more reliable to specify the upper and lower levels explicitly using this type of formula. Microsoft Analysis Services allows this formula to be written more simply.
ApplySimple("Avg({ .CurrentMember.Siblings }, #0)", Revenue)
When using the Ancestor or Parent MDX functions, unexpected results may be returned if the topmost attribute in the hierarchy is on the template. Members belonging to the topmost hierarchy level do not have any ancestors, meaning that for these members, the aggregation would be performed over an empty set. The result of that calculation will be empty.
If it is the total, rather than the average, that is needed, the formula can be simplified further:
ApplySimple("(#0, Ancestor(.CurrentMember, .))", Revenue)
The difference between this formula and the aggregation over the ancestor's descendents is subtle but important. The previous formulas obtain a set of hierarchy members at the same level as the current member and aggregate the values for those members. This last formula obtains the parent attribute element for the current template element being evaluated in the database, and returns the metric value associated with the parent element. (This, in fact, need not be a sum; the value's calculation method is determined by the cube architect.) Numerically, the results might be the same, but in terms of the cube, the meaning is not quite identical.
Some cube providers evaluate the above formulas inconsistently if multiple levels of the same hierarchy are on the template.
