EducationSoftwareStrategy.com
StrategyCommunity

Knowledge Base

Product

Community

Knowledge Base

TopicsBrowse ArticlesDeveloper Zone

Product

Download SoftwareProduct DocumentationSecurity Hub

Education

Tutorial VideosSolution GalleryEducation courses

Community

GuidelinesGrandmastersEvents
x_social-icon_white.svglinkedin_social-icon_white.svg
Strategy logoCommunity

© Strategy Inc. All Rights Reserved.

LegalTerms of UsePrivacy Policy
  1. Home
  2. Topics

KB16718: Y-axis interval not displaying values for different data in a graph report in MicroStrategy Developer


Stefan Zepeda

Salesforce Solutions Architect • Strategy


The Y-Axis in a MicroStrategy Developer graph does not display interval values or tick marks.

SYMPTOM:
The Y-Axis in a Strategy Developer graph does not display interval values or tick marks, as illustrated below. This behavior is most likely to be seen in prompted reports.
 

ka02R000000kUllQAE_0EM440000002F9t.jpeg

 
STEPS TO REPRODUCE:
Follow the steps below to reproduce this issue in the Strategy Tutorial project:
 

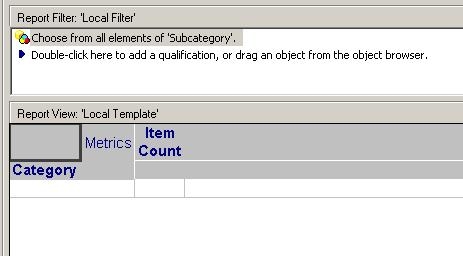
  • Create a report with the 'Category' attribute, the 'Item Count' metric, and a prompted report filter, as shown below:
ka02R000000kUllQAE_0EM440000002F9n.jpeg
  • Use Subcategory to filter the report and the prompt to select Subcategories, as shown below:
ka02R000000kUllQAE_0EM440000002F9u.jpeg
  • Execute the report and select Subcategory elements (e.g. 'Arts & Architecture', 'Business' and 'Literature') as shown below:
ka02R000000kUllQAE_0EM440000002F9x.jpeg
  • Modify the 'Grids and Scales' settings under the 'Y1 Axis' and 'Grids' tabs and set the interval to the minimum (approx. 2) as shown below:
ka02R000000kUllQAE_0EM440000002F9w.jpeg
  • Execute the report. The user should see a graph similar to this:
ka02R000000kUllQAE_0EM440000002F9v.jpeg
  • Re-execute the report and when prompted, select a greater number of subcategories so the maximum value on the graph's Y axis is larger, as shown below:
ka02R000000kUllQAE_0EM440000002F9m.jpeg
  • Execute the report and notice that the user will not see any values on the Y-axis except for the minimum and the maximum, as shown below:
ka02R000000kUllQAE_0EM440000002F9t.jpeg

CAUSE:
 
The interval value has a minimum and maximum based on the maximum value on the graph. The problem arises when the initial interval is too small for the number of elements selected in the prompt when the report is re-executed.
 
This is a known issue in Strategy Developer.
 
ACTION:
 
Strategy will continue to investigate and post updates as soon as they are available.
 
WORKAROUND:
The only workaround available at this time is to manually reset the interval value on the 'Grids and Scales' menu settings by modifying the 'Grids and Scales' settings under the 'Y1 Axis' and 'Grids' tabs as shown in step 4 of this document.


Comment

0 comments

Details

Knowledge Article

Published:

June 2, 2017

Last Updated:

June 2, 2017