EducationSoftwareStrategy.com
StrategyCommunity

Knowledge Base

Product

Community

Knowledge Base

TopicsBrowse ArticlesDeveloper Zone

Product

Download SoftwareProduct DocumentationSecurity Hub

Education

Tutorial VideosSolution GalleryEducation courses

Community

GuidelinesGrandmastersEvents
x_social-icon_white.svglinkedin_social-icon_white.svg
Strategy logoCommunity

© Strategy Inc. All Rights Reserved.

LegalTerms of UsePrivacy Policy
  1. Home
  2. Topics

KB16777: How to create a project versus project integrity test in MicroStrategy Integrity Manager 9.x - 10.x


Stefan Zepeda

Salesforce Solutions Architect • Strategy


This technical note explains how to create a project versus project integrity test in MicroStrategy Integrity Manager 9.x - 10.x

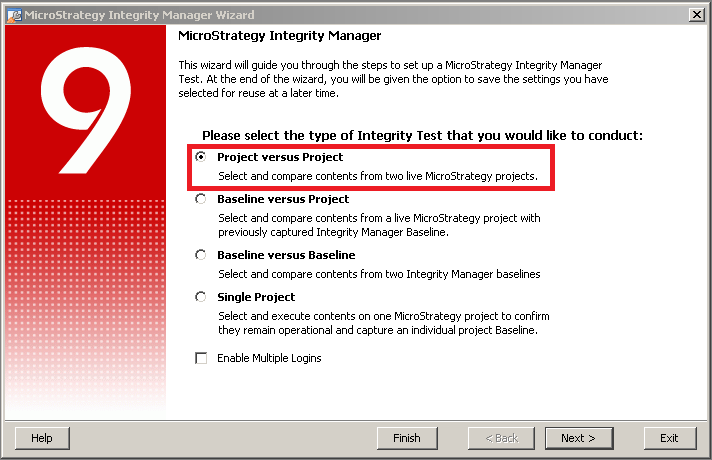
In a project-versus-project integrity test, Strategy Integrity Manager executes reports from two different projects and compares them to see any differences in SQL, data, or graphs. This is different from a baseline-versus-project integrity test, where reports from a project are compared with a previously generated set of reports.
 
Some example situations where a project-versus-project integrity test would be useful include:
 

  • Moving a project from one environment to another, for example, out of development and into production
  • Modifying the data warehouse ODBC information (executing against a different warehouse)
  • Migrating Strategy Intelligence Server to a different operating system
  • Upgrading to a new version of Strategy

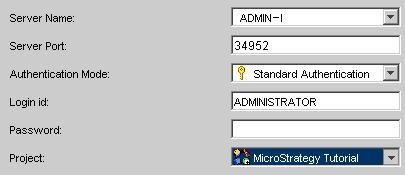
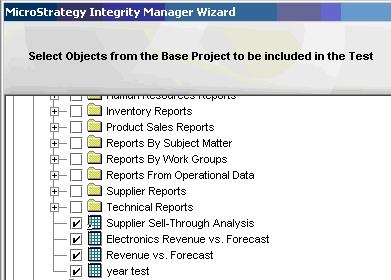
In a project-versus-project integrity test, the user designates one project to be the base project. Strategy Integrity Manager executes the specified reports from this project, and then executes the same reports in the target project.
 
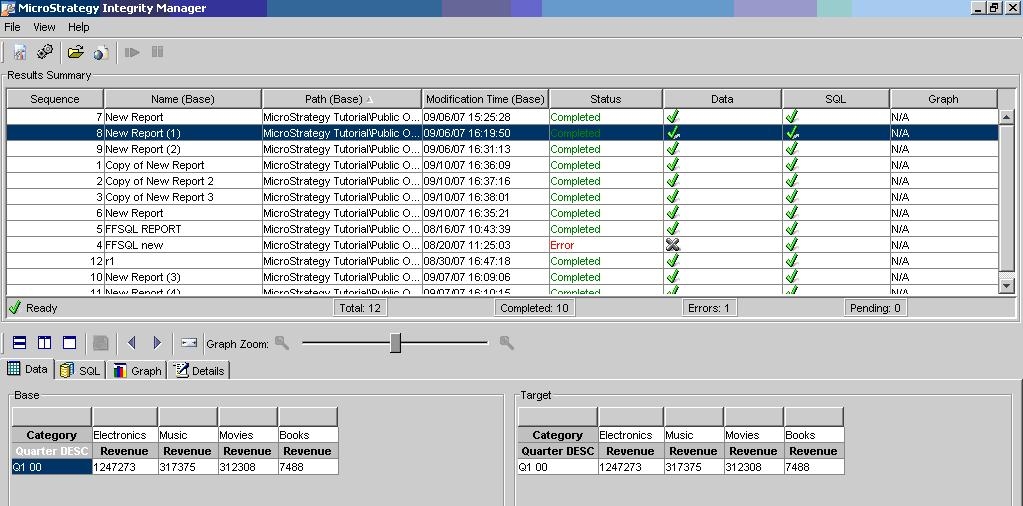
Users can compare the report data, the generated SQL code, and the graphs for the tested reports. Strategy Integrity Manager informs which data, SQL, and graph reports are different between the two projects and highlights the discrepancies. Users must visually inspect any graphs marked as different to determine where the differences are located.
 
Prerequisites for comparing reports from two projects:
 

  • To compare reports from two projects with Strategy Integrity Manager, users must have the 'Use Integrity Manager' privilege for both projects. Users must also have the Execute permission for any reports to be tested. For information on privileges and permissions, see the Strategy System Administration Guide.
  • Strategy Integrity Manager can only test three-tier projects, that is, projects that are attached to a Strategy Intelligence Server. Projects in Direct Connection (two-tier) mode cannot be tested with this tool.

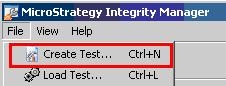
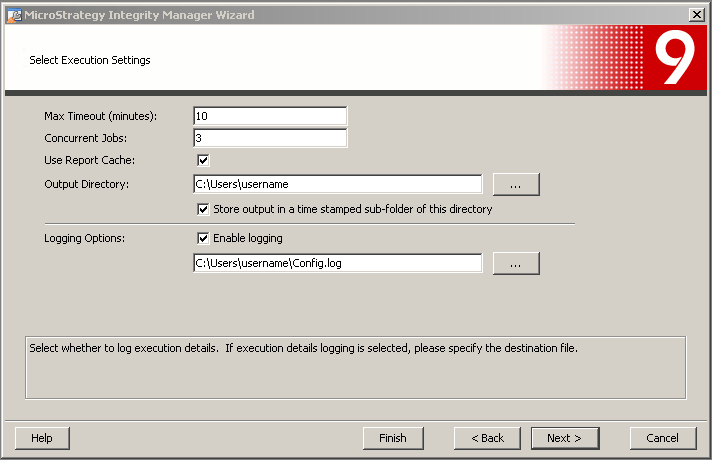
To compare reports from two projects:
 

  • Open Strategy Integrity Manager from the Start menu > Programs > Strategy > Integrity Manager.
  • From the File menu, select 'Create Test.' The Integrity Manager Wizard opens and the Welcome page is displayed, as shown below:
ka02R000000kbgWQAQ_0EM440000002FA6.jpeg
  • Select 'Project versus Project' test and click Next, as shown below:
ka02R000000kbgWQAQ_0EM440000002FAG.png
  • In the Server Name field, specify the name of the Strategy Intelligence Server machine on which the base project resides. This project contains the reports against which users want to compare reports from a different project. The Integrity Manager Wizard automatically populates the Server Port field. If Strategy Intelligence Server is running on a different port, enter that port number in the Server Port field, as shown below:
ka02R000000kbgWQAQ_0EM440000002FAE.jpeg
  • From the Authentication drop-down list, select the type of authentication to use with the login and also provide a Strategy Login and Password to connect to the project.
  • From the Project drop-down list, select the base project and click Next.
  • In the Server Name field, specify the name of the Strategy Intelligence Server machine on which the target project resides. This project contains the reports to be compared against the base project.
  • Repeat step 5 and select the target project from the drop-down list.
  • Select the reports to be compared and click Next, as shown below:
ka02R000000kbgWQAQ_0EM440000002FA4.jpeg
  • To provide a default answer for one of the three types of value prompt, in case that the selected reports have value prompts, select its check box and then enter the desired default answer in its field. Other types of prompts are answered automatically. For more information about value prompts, see the Strategy Basic Reporting Guide.
  • The user will be presented with some execution settings that he can adjust depending on their environment, as shown below:
ka02R000000kbgWQAQ_0EM440000002FAA.png
    • Max Timeout: Enter the maximum number of minutes to wait for a report to finish executing.
      Note: If the timeout setting for Strategy Intelligence Server is less than Strategy Integrity Manager timeout setting, reports may time out before the time allotted in this field.
       
    • Concurrent Jobs: Enter the maximum number of reports to execute at the same time.
      Warning: Setting this number higher than the default value, especially on a Strategy Intelligence Server that is being used in production, may cause an extreme load on Strategy Intelligence Server. This may cause reports to time out or, in severe cases, may cause the Strategy Intelligence Server to shut down unexpectedly.
       
    • Output Directory: Specify the location in which the results of the test are stored. To store the results of the test in a location specified by the date and time of execution, select the Store output in a time-stamped subfolder of this directory option.
    • Logging Options: To enable logging, select the Enable logging check box. Specify the name and location of the log file in the field below the check box and click Next.
  • Select the type of report data for Strategy Integrity Manager to analyze. More than one may be selected.
     
    • To analyze the generated SQL for each report, select Compare SQL.
    • To analyze the grid data for each report, select Compare Data.
    • To analyze the generated graph for each report, select Compare Graph.
    • To analyze PDF and Excel, select the appropriate checkboxes.
  •  
    Note: Only reports that have been saved in Graph or Grid/Graph view can be compared as graphs. And Excel output can only be compared if Microsoft Excel is installed on the machine.
     
  • Click Next. The Summary page opens. The user can review the information presented. To make changes, click Back until the page that contains the information that needs to be changed is displayed.
  • When satisfied that the test settings shown on the Summary page are correct, click Run. The Integrity Manager wizard closes and Strategy Integrity Manager begins to execute the selected reports. As the reports execute, the results of each report appear in the Results Summary area of the Strategy Integrity Manager interface, as shown below:
ka02R000000kbgWQAQ_0EM440000002FAC.jpeg

To save the test for later use, go to File > Save Test. Navigate to the desired directory, enter the file name, and click OK. A baseline file will be saved too in order to compare the reports contained on it against an online project.


Comment

0 comments

Details

Knowledge Article

Published:

June 12, 2017

Last Updated:

June 12, 2017