EducationSoftwareStrategy.com
StrategyCommunity

Knowledge Base

Product

Community

Knowledge Base

TopicsBrowse ArticlesDeveloper Zone

Product

Download SoftwareProduct DocumentationSecurity Hub

Education

Tutorial VideosSolution GalleryEducation courses

Community

GuidelinesGrandmastersEvents
x_social-icon_white.svglinkedin_social-icon_white.svg
Strategy logoCommunity

© Strategy Inc. All Rights Reserved.

LegalTerms of UsePrivacy Policy
  1. Home
  2. Topics

KB17076: How to interpret the integrity test results in MicroStrategy Integrity Manager 9.x


Stefan Zepeda

Salesforce Solutions Architect • Strategy


When running a Project vs Project or Baseline vs Project integrity test in MicroStrategy Integrity Manager 9.x, the results summary window shows a quick overview of the results, as illustrated below:

When running a Project vs Project or Baseline vs Project integrity test in Strategy Integrity Manager 9.x, the results summary window shows a quick overview of the results, as illustrated below:
 

ka02R000000kVbmQAE_0EM440000002F5G.png

 
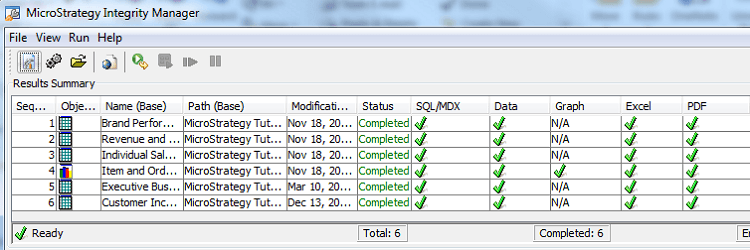
Check the following information in order to understand the meaning of those results:
 

  • Matched
ka02R000000kVbmQAE_0EM440000002F5F.jpeg
  • indicates that the results from the two projects are identical for that report.
     
  • Not Matched
ka02R000000kVbmQAE_0EM440000002F5Y.jpeg
  • indicates that there is a discrepancy between the two projects for that report. To view a comparison of the reports from each project in the Report Data area, select the report.
     
    Note: Once a discrepancy is found in SQL, the comparison will stop and will mark both reports as Not matched since they are different.
     
  • Not Compared
ka02R000000kVbmQAE_0EM440000002F5H.jpeg
  • indicates that Strategy Integrity Manager 9.x was unable to compare the reports for that type of analysis. Some of the reasons could be:
     
    • The report was not found in the target project.
    • One or more prompts for the report are not supported by Strategy Integrity Manager 9.x
    • An error prevented one or both reports from executing.
  •  
    The user can get more information of the particular cause in the Details tab.
     
  • Not Available
ka02R000000kVbmQAE_0EM440000002F5E.jpeg
  • indicates that this type of analysis was not selected on the Select Processing Options page. If only the Graph column is marked as Not Available, the report has not been saved as a Graph or Grid/Graph and that is why it cannot be compared.

Comment

0 comments

Details

Knowledge Article

Published:

May 31, 2017

Last Updated:

May 31, 2017