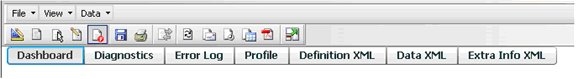
The Flash Debugger is an invaluable troubleshooting tool that allows all of the components of a Flash document to be viewed separately. The Flash Debugger requires Flash 9 or higher. To enable the Flash Debugger, open a Flash document in Strategy Web 8.1.x and 9.0.x, view in Flash mode, and press CTRL + ALT + SHIFT + D. Once this key sequence is pressed an extra menu will appear below the standard menu, as shown below::
DASHBOARD
This is the default Flash view. It will allow users to view the Flash document at runtime.
DIAGNOSTICS
Diagnostics displays hierarchical representation of document's object model or structure.
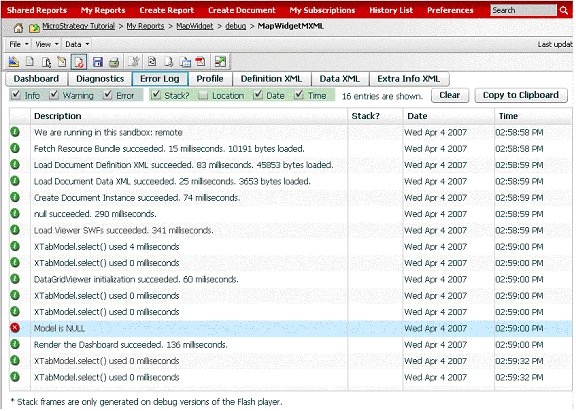
ERROR LOG
Error Log displays the error log, as well as the main flash tasks, as shown below:
PROFILE
Profile lists the steps taken for rendering the document. This tab is useful for performance troubleshooting.
DEFINITION XML
Definition XML displays the XML returned from the Strategy Intelligence Server 8.1.1 for the Flash document's definition.
DATA XML
Data XML displays the XML returned from the Strategy Intelligence Server 8.1.1 for the document's data.
EXTRA INFO XML
Extra Info XML displays the settings required for rendering the document in Flash mode.