EducationSoftwareStrategy.com
StrategyCommunity

Knowledge Base

Product

Community

Knowledge Base

TopicsBrowse ArticlesDeveloper Zone

Product

Download SoftwareProduct DocumentationSecurity Hub

Education

Tutorial VideosSolution GalleryEducation courses

Community

GuidelinesGrandmastersEvents
x_social-icon_white.svglinkedin_social-icon_white.svg
Strategy logoCommunity

© Strategy Inc. All Rights Reserved.

LegalTerms of UsePrivacy Policy
  1. Home
  2. Topics

KB17422: How to only display rows in a report that contain at least one cross-tab null in the row on MicroStrategy Developer


Stefan Zepeda

Salesforce Solutions Architect • Strategy


This article outlines how to only display rows in report that contain at least one cross-tab null in the row on MicroStrategy Developer

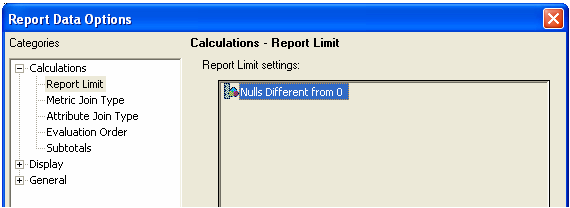
A report with cross tabbing nulls needs to be filtered on 'n' number of null generated in a row and display the whole row in Strategy Developer
Placing attributes in both the rows and columns of a report may return cross-tab nulls. Under certain situations, these nulls can be of significance and a user may want to examine these rows more closely. This technical note will provide instructions on how to create a filter that will only return rows were at least one null is returned.
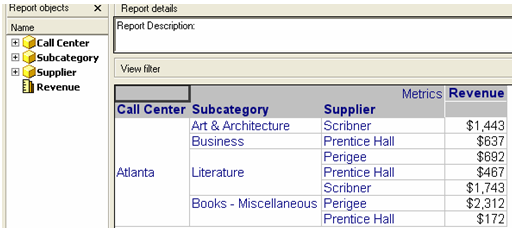
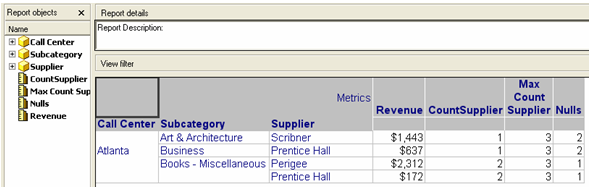
The report looks as shown below.

ka02R000000kYTyQAM_0EM440000002F0q.jpeg

 
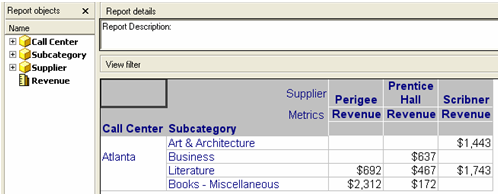
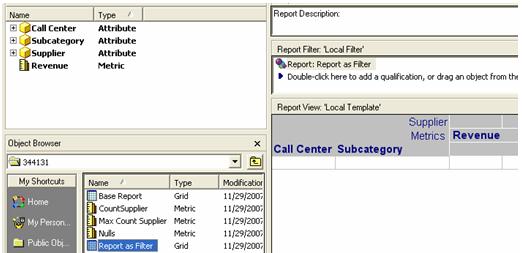
Strategy cannot directly use cross-tab nulls in report filters. To workaround this issue, a report-as-filter needs to be created that returns the attribute elements associated with null values. This report-as-filter is then used to limit the final report data to only include rows that contain one or more null values.
 
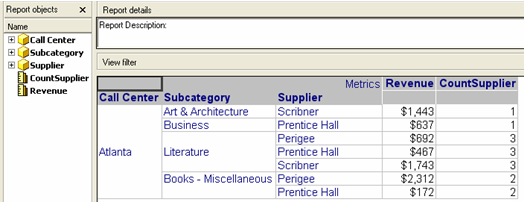
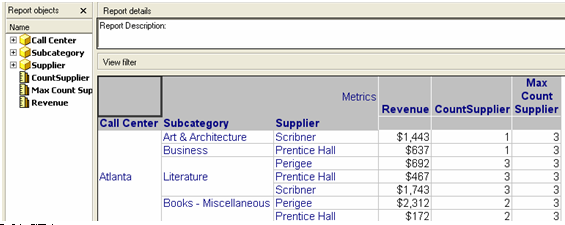
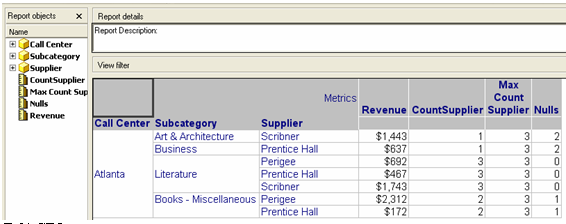
To implement the workaround, do the following:
 

  • Create a new report with the same attributes and metrics of the base report. Place all of the attributes on the rows, as shown below:
ka02R000000kYTyQAM_0EM440000002F0P.jpeg
  • Create a new metric that counts the number of attributes as shown in the image below:
ka02R000000kYTyQAM_0EM440000002F0O.jpeg
  • Create a new metric that get the maximum of the elements based on the metric previously created as shown below:
ka02R000000kYTyQAM_0EM440000002F0x.jpeg
  • Create a new metric that calculates the difference between both metric previously added as shown below:
ka02R000000kYTyQAM_0EM440000002F0a.jpeg
  •  
    Note: This metric will calculate the number of cross tabbing nulls that will be generated on the report.
     
  • Create a set Report Limit where Nulls Metric is different from 0, as shown below:
ka02R000000kYTyQAM_0EM440000002F0r.jpeg
  • The elements shown below should appear:
ka02R000000kYTyQAM_0EM440000002F0N.jpeg
  • Save and close the report.
  • Use the report created as a filter for the base cross tabbing report and run the report. This can be done by dragging and dropping the report as filter into the base report filter as shown in the image below:
ka02R000000kYTyQAM_0EM440000002F0R.jpeg
  • The report now should filter on those rows that contain any number of cross tabbing nulls, except 11, as shown below. Expand on this to include instructions on how to do this.
ka02R000000kYTyQAM_0EM440000002F0T.jpeg

Comment

0 comments

Details

Knowledge Article

Published:

June 8, 2017

Last Updated:

June 8, 2017