EducationSoftwareStrategy.com
StrategyCommunity

Knowledge Base

Product

Community

Knowledge Base

TopicsBrowse ArticlesDeveloper Zone

Product

Download SoftwareProduct DocumentationSecurity Hub

Education

Tutorial VideosSolution GalleryEducation courses

Community

GuidelinesGrandmastersEvents
x_social-icon_white.svglinkedin_social-icon_white.svg
Strategy logoCommunity

© Strategy Inc. All Rights Reserved.

LegalTerms of UsePrivacy Policy
  1. Home
  2. Topics

KB17442: How to specify a custom color sequence for a graph series using MicroStrategy Desktop 9.x


Stefan Zepeda

Salesforce Solutions Architect • Strategy


Users may want to specify a custom color sequence for a graph series using Strategy Desktop 9.x. The specification is made at the report level, and there is an enhancement request to specify the color sequence used at the project level. To do this, follow the steps below:
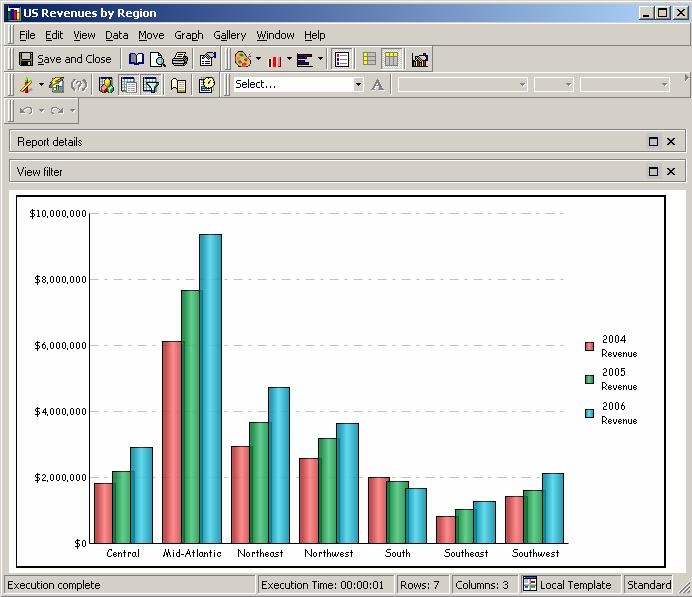
 

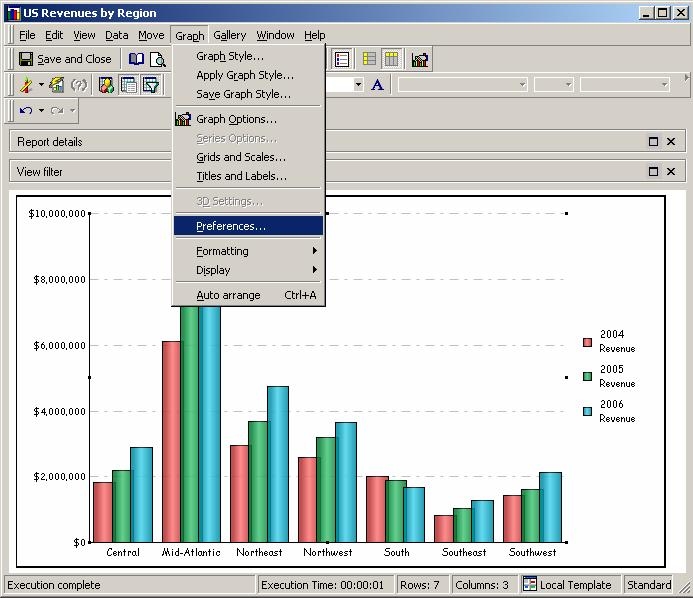
  • Using any graph report, run the graph from the Strategy Desktop 9.x environment. This example uses the US Revenues by Region graph report from the Strategy Tutorial project, as shown below:
ka02R000000kbr2QAA_0EM440000002F0M.jpeg
  • In the Report Editor window, select Graph > Preferences , as shown below:
ka02R000000kbr2QAA_0EM440000002F0G.jpeg
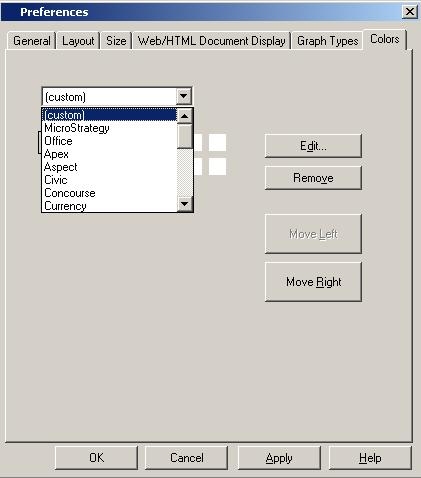
  • In the Preferences window, select the Colors tab. On this tab, the user will have the option to specify a custom color sequence by selecting (custom) from the dropdown list. The user may also choose from a number of preset color schemes by selecting another option from this same dropdown list.
ka02R000000kbr2QAA_0EM440000002F0D.jpeg
  •  
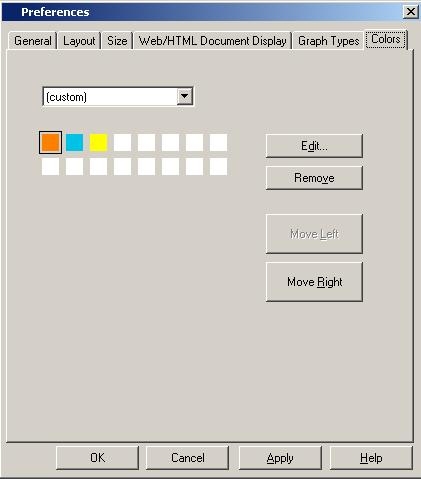
    The white and colored squares beneath the dropdown list indicate, in order from the top-left corner to the right, which colors will display in sequence for a graph with multiple series. Clicking the Move Left or Move Right buttons will move the selected color (shown with a black box drawn around the colored box) left or right respectively, thus placing the color earlier or later in the sequence. This black box is easier to see in a later screenshot. Clicking the Remove button will remove the color from the sequence and shift the remaining colors to the left to fill in any gaps.
     
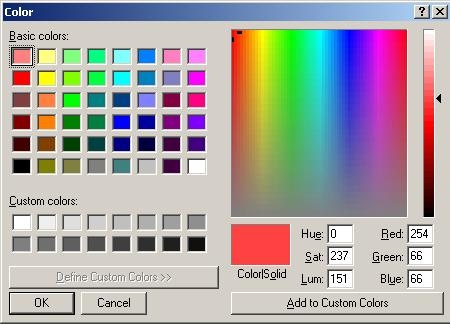
  • To specify a custom color, click the Edit button when a desired color to change is selected. This will open up another window, as shown below:
ka02R000000kbr2QAA_0EM440000002Ezu.jpeg
  •  
    In this Color window, the user can specify a custom color with RGB and Hue, Saturation, and Luminosity settings, as is common in many image-editing applications. The user can also choose from a number of basic colors already defined. Clicking the Add to Custom Colors button will make the currently defined color appear in the Custom colors boxes the next time this window is opened.
     
    NOTE: If the full window as displayed in the above screenshot is unavailable, click the Define Custom Colors button.
     
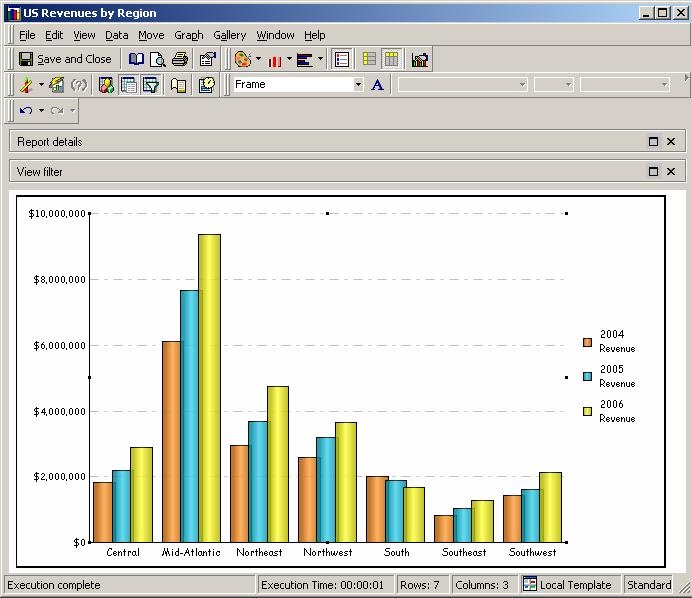
  • Click OK. In this example, the color sequence chose has orange, sky blue, and yellow. Clicking 'Apply' will apply this color sequence to the currently opened graph. This will allow the user to see how the graph looks while keeping this window open, if the user prefers the trial-and-error approach to aesthetics.
ka02R000000kbr2QAA_0EM440000002F0F.jpeg
  • Click OK to dismiss this window and see the color change applied, as shown below:
ka02R000000kbr2QAA_0EM440000002F0L.jpeg


Comment

0 comments

Details

Knowledge Article

Published:

June 7, 2017

Last Updated:

June 7, 2017