EducationSoftwareStrategy.com
StrategyCommunity

Knowledge Base

Product

Community

Knowledge Base

TopicsBrowse ArticlesDeveloper Zone

Product

Download SoftwareProduct DocumentationSecurity Hub

Education

Tutorial VideosSolution GalleryEducation courses

Community

GuidelinesGrandmastersEvents
x_social-icon_white.svglinkedin_social-icon_white.svg
Strategy logoCommunity

© Strategy Inc. All Rights Reserved.

LegalTerms of UsePrivacy Policy
  1. Home
  2. Topics

KB17570: How to change the evaluation order of a dashboard to reflect the evaluation order set on the underlying dataset in MicroStrategy


Community Admin

• Strategy


This article describes how to set the evaluation order of objects on a report services document to match its source dataset

SYMPTOM:
 
When using dashboards, the evaluation order of the calculation of its elements might appear different from that of the underlying report/dataset, especially with reports including smart metrics and consolidations that require changes on the evaluation order of a report.
 
STEP TO REPRODUCE:
 
In order to illustrate this behavior, an example will be shown in the Strategy Tutorial project:
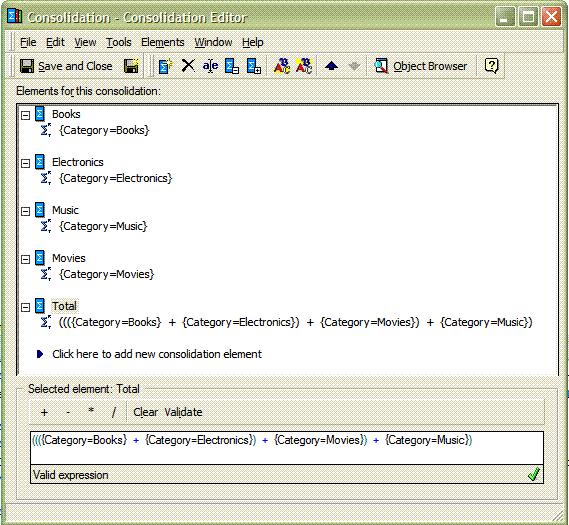
  • In the Strategy Tutorial project, build a consolidation including these elements:
    • Books: Category = Books
    • Electronics: Category = Electronics
    • Music: Category = Music
    • Movies: Category = Movies
    • Total: Category = { Books + Electronics + Music + Movies }
ka04W000000Oao1QAC_0EM440000002EqI.gif
    •  
      The last element of the consolidation is used to act as a total, as totals are not available in Report Services.
  • Build a metric called `Revenue` as a normal copy of Tutorial Revenue: Sum(Revenue){~+}
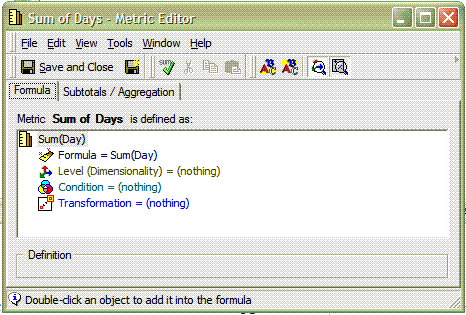
  • Build a metric called `Sum of Days` as a sum on the attribute Day: Sum(Day) {~+}
ka04W000000Oao1QAC_0EM440000002EqO.gif
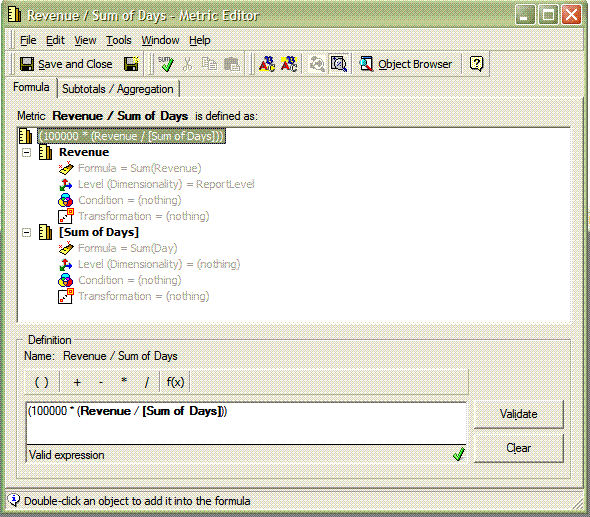
  • Build a compound metric `Revenue / Sum of Days` as the ratio of the two previous metrics: 10000 * (Revenue / Sum of Days) , enable smart metric, as shown below:
ka04W000000Oao1QAC_0EM440000002EqE.gif
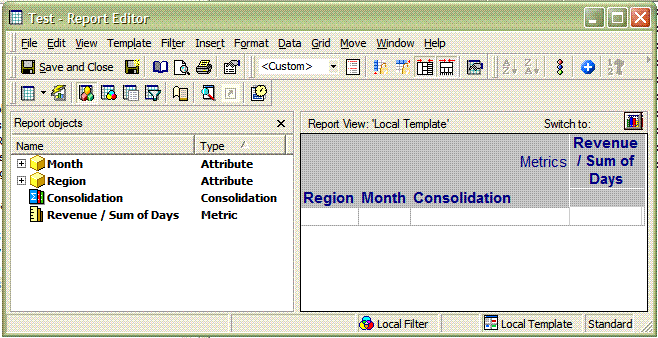
  • Build a report called `Test` with Region, Month, Consolidation, and Revenue/Sum of days, as shown below:
ka04W000000Oao1QAC_0EM440000002Eq8.gif
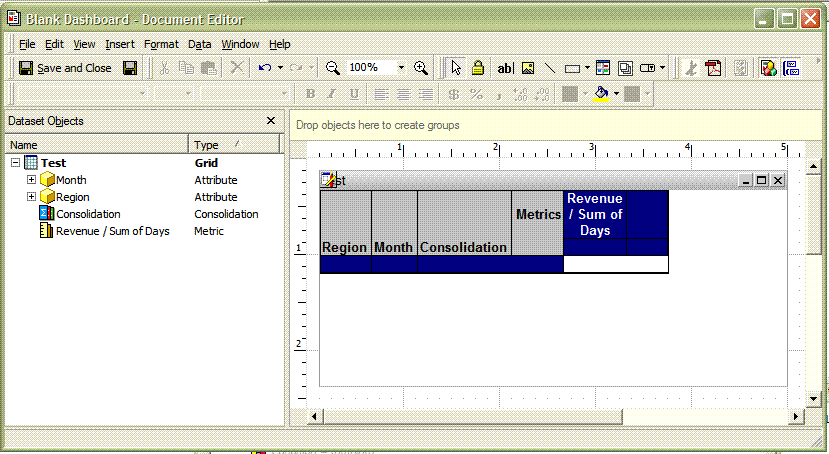
  • Build a Report Services document using the Blank Dashboard template, including the Test Report as a source dataset, and add it to the Body of the dataset with formatting. Sort the dashboard template order as the report: Region/Month/Consolidation/Metric
ka04W000000Oao1QAC_0EM440000002EqG.gif
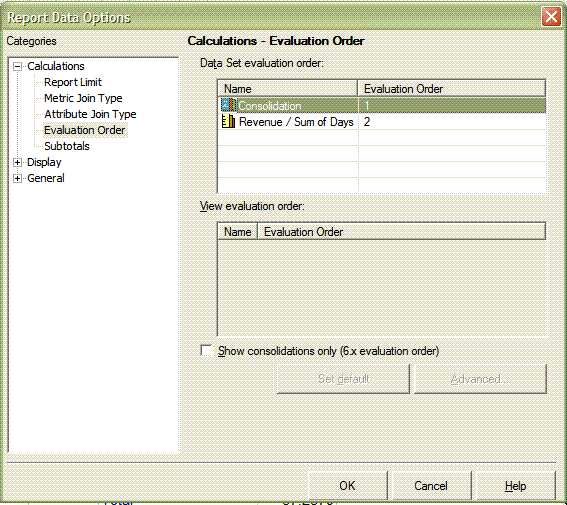
  • Now change the evaluation order of the report from Report Data Options, setting for example the consolidation first and the metric second. This will make sure the report will give correct results, as the default evaluation order (compound metric before consolidation) would give incorrect results for this report.
ka04W000000Oao1QAC_0EM440000002EqL.gif
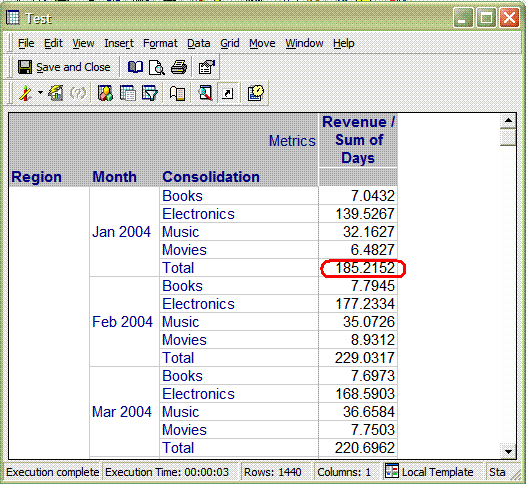
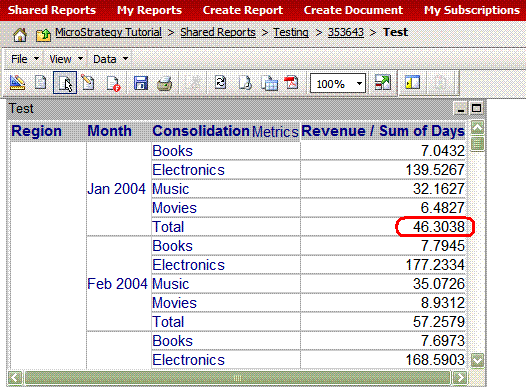
  • Open both the dashboard Test and the report Test in Strategy Web. The element `Total` of the consolidation will give a different result when viewed from the dashboard compared with the report. Therefore, the dashboard is not reflecting the changes done on the Report Evaluation Order.
     
    Report Results:
ka04W000000Oao1QAC_0EM440000002EqQ.gif
  •  
    Dashboard results with consolidation giving different results:
ka04W000000Oao1QAC_0EM440000002EqC.gif

 
CAUSE:
 
A dashboard has its own predefined evaluation order which is not, by default, set to match the underlying Dataset evaluation order. This is as designed as in the case of multiple datasets, there would be the problem of which dataset evaluation order to adopt.
 
ACTION:
 
If the same evaluation order of the underlying dataset is required, it is necessary to make the appropriate changes from inside the dashboard editor.
 
Double click on the grid placed on the dashboard template and select the menu /Data/Grid Option. Then for any metric present, set the order to default and set on the 'Advanced' tab to 'Evaluate in the Data Set' instead of 'Evaluate in the View,' which is the default value. Follow the steps below:
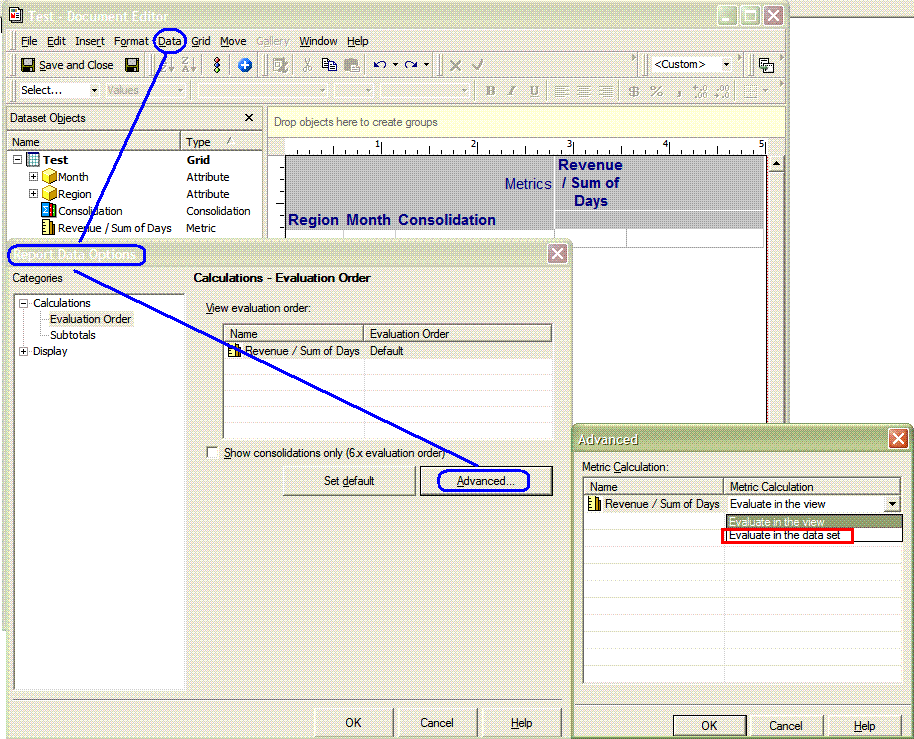
 

  • Open the dashboard in Edit Mode.
  • Double click on the grid.
  • Click on Grid Report Data Option and select the metric.
  • Click on Advanced and select 'Evaluate in the Dataset.'
  • This will force the analytical engine on use the same evaluation order used on the original dataset, as shown below:
ka04W000000Oao1QAC_0EM440000002EqA.gif

NOTE: Now the order of any dataset present on the dashboard will reflect the order of the correspondent dataset. Repeat this procedure for any dataset present in the report in case of multiple-dataset dashboard.
 
KB17570


Comment

0 comments

Details

Knowledge Article

Published:

May 5, 2017

Last Updated:

December 31, 2018