The procedure below describes how to modify data labels to present null values as zeros in a graph report or visualization within a dashboard.
Follow the steps below to reproduce this behavior:
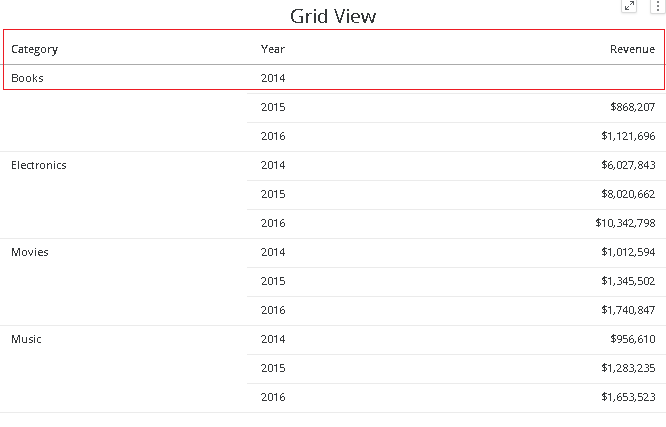
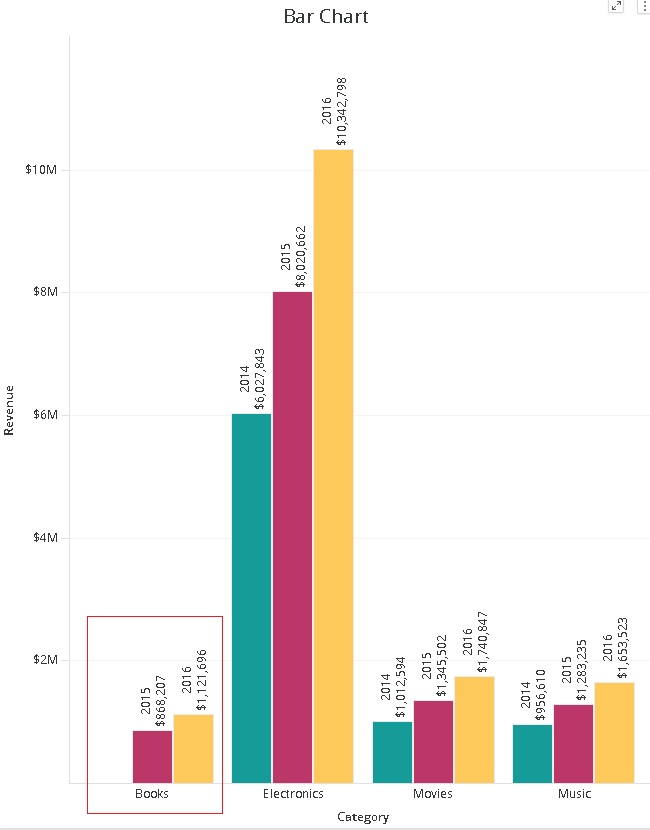
This is expected behavior. Data labels don't display null values in a graphical representation in reports and dashboard visualizations. Therefore there are no labels for 2014 data for category Books.
A user may find it useful to display zeros instead. In order to achieve this, create a derived metric using the NullToZero function as shown in the image below:
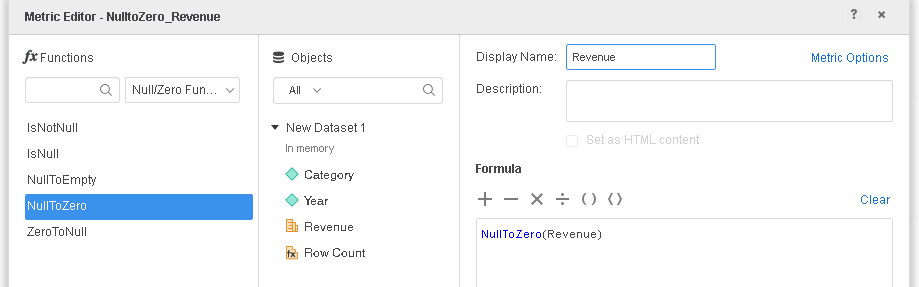
NullToZero(Revenue)
Use this metric in the graph instead of the Revenue metric and run the dashboard, as shown below:
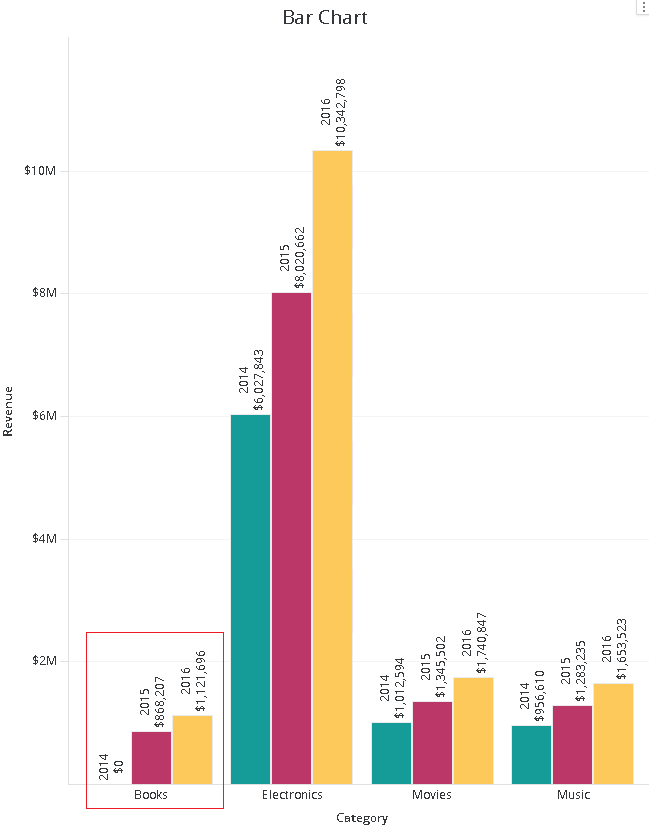
Notice how even though there is no bar for Books 2014, the graph's data label still appears showing a value of Zero.
The same steps can be followed to display null data labels in a graph report.
Additionally, the availability of graph view in reports is not present in Workstation and Library. To incorporate graphs, it is necessary to create a dashboard.