In Strategy Developer 9.4.x - 10.x, the Ntile function sets up numbers of groups or tiles for a metric. An example of this would be to break the attribute Month into four tiers according to Revenue.
The report below shows how the Ntile Metric breaks Month into four tiers (1,2,3, and 4).

Notice that the Months are grouped into 4 tiers according to Revenue. The Ntile metric returns a 1 for metrics in the top 25 percent and a 4 for those in the bottom 25 percent.
To create the Ntile metric, follow the steps below:


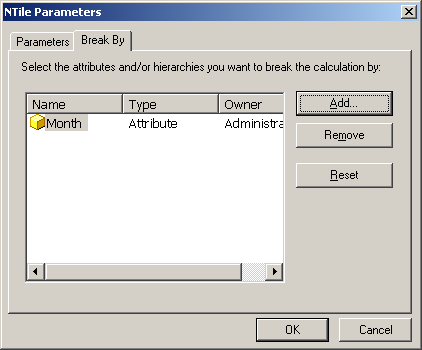
NOTE: For more information about how parameters affect Ntile function, refer to the following Strategy Knowledge Base technical note:
KB12158 (KB5700-75x-1564): How does the NTileValue Function work?
