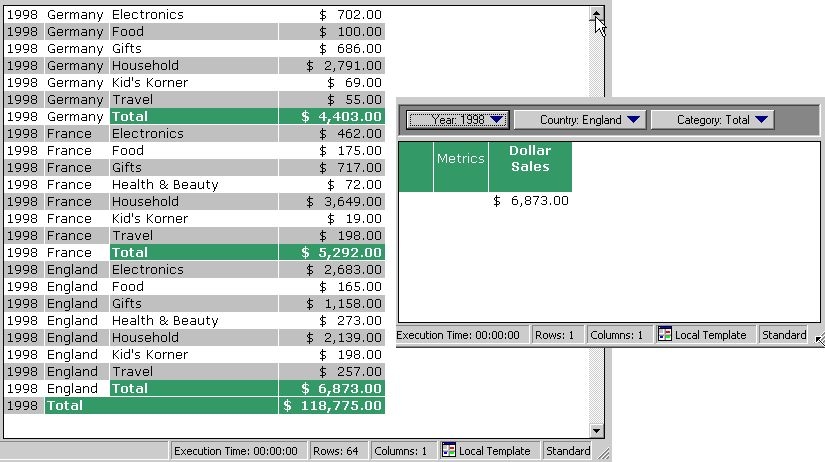
It is possible to have a report with multiple attributes in the page-by field and only display totals for one of the attributes.
For more information, refer to the following Strategy Knowledge Base technical note:
KB9373: In Strategy Developer 9.x and 10.x, how to have a report with multiple attributes in the Page-by field and display the element 'total' only for the first Page-by field?
It is also possible to have multiple attributes to be independent of each other so that each page-by displays all the elements along with the Totals.
For more information, refer to the following Strategy Knowledge Base technical note:
KB14144: How to configure multiple page-by attributes to be independent of each other so that each page-by displays all the elements along with the Totals in Strategy Developer 9.x and 10.x
However, both options are mutually exclusive since both of them require different levels and parameters for the totals.
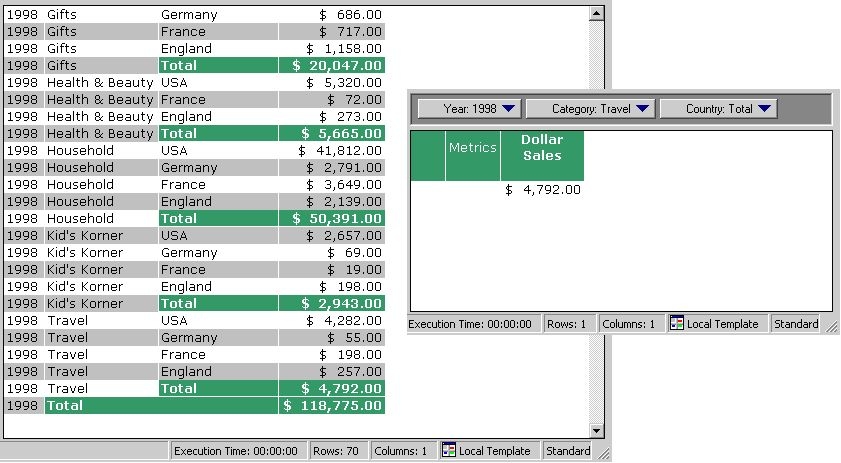
To explain the behavior, consider an example in the Strategy Tutorial project. Create a report with Year, Category, and Country in the row, then Revenue in the column. Now, add a subtotal across the Category and Country level and execute the report, as shown below:
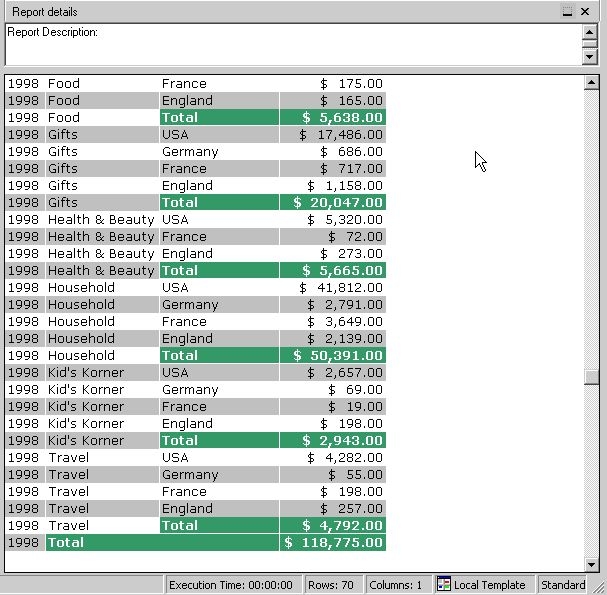
Move the Year, Category, and Country attributes under the page-by axis in that order. Year will not show any total as a possible selection, but Category and Country will. This should be obvious given the grid above. Select Year = 1998, Category = Travel and Country = Total first, as shown below:
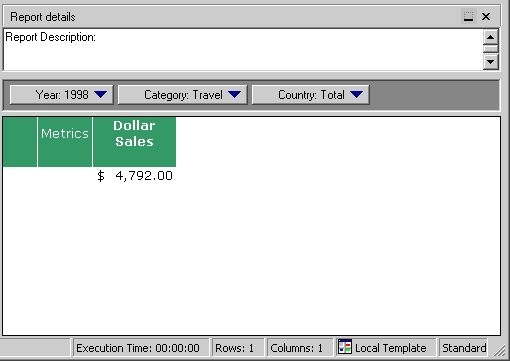
As illustrated in the image above, the value displayed corresponds to the second to last row in the report. Everything is working fine so far.
Now, the user wants to select Category = Total and Country = xxx. However, when selecting Category = Total, the Country page is automatically set to Total, as shown below:
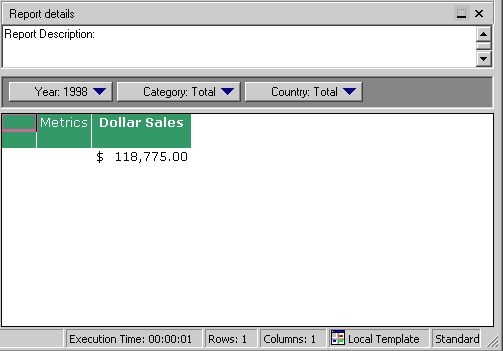
This behavior should not be surprising. When looking back at the grid data, Year, Category, and Country appeared in that order on the row axis for the report. As the user is trying to view Year = 1998 and Category = Total, the user is automatically selecting the last row of the report which corresponds to Year = 1998, Category = Total and Country = Total
In other terms, when users want to create combinations such as Year = 1998, Category = Total and Country = xxx or Year = 1998, Category = xxx and Country = Total, we are looking at computing totals in two different ways. One implies that the user is computing the totals for each Category within each Country, and the other one implies that the user is computing the totals for each Country within each Category. It is impossible to get such data using a unique grid representation. The user would need to use pivoting to get one or the other. It is the same for the page-by representation as demonstrated below:
1- Year, Category and Country appear in that order so the user can find the Country total for each selection of {Year, Category}:
2- Year, Country and Category appear in that order so the user can find the Category total for each selection of {Year, Country}: