Strategy has data mining functions for multivariable regression analysis. With careful choice of independent variables, the regression estimates can match the given data more closely and estimate future trends with greater confidence than basic slope functions.
The general procedure is as follows:
Regression analysis using data mining functions is described in full in Chapter 12 of the Strategy Advanced Reporting Guide. The following is intended as a general introduction and does not cover all possible scenarios.
Creating the training metric
Training metrics are built in the Training Metric Wizard, accessed from the Tools menu in Strategy Developer.
The Training Metric Wizard has an important prerequisite. Metrics must be created to serve as independent variables. Typically these reflect attribute data, but attributes may not be used for independent variables. For such attributes, metrics should be created with the formula Max(attribute@ID).
Care should be taken with time data, to ensure those successive units of time map onto successive integers. For example, Quarter IDs in the Strategy Tutorial project proceed as follows: 20041, 20042, 20043, 20044, 20051, 20052 and so on. The large gap between 20044 and 20051 does not accurately reflect the fact that 20043-20044 and 20044-20051 represent the same period, and this will confuse the regression model. The Strategy Tutorial project includes an example of a QuarterIndex metric that converts Quarter and Year IDs into a sequence of integers:

((Max(Quarter@ID) {~} - (10 * Max(Year@ID)) {~} ) + ((Max(Year@ID) {~} - 2004) * 4))
In other cases, the Strategy RunningCount() or RunningSum() functions could be used to generate the sequence.
Consistency is critical to successful regression analysis. It is important to verify that the independent variable metrics produce sensible data.
The Training Metric Wizard consists of the following screens. First, choose the type of analysis desired. This example will use linear regression. Consult the Strategy Advanced Reporting Guide for more information on the types of analysis, and on the Alpha parameter.

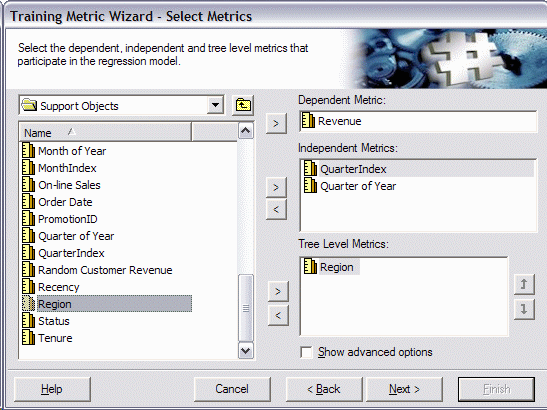
On the next screen, choose the dependent, independent and tree level metrics.
The next screen defines which the predictive metric(s) will be created. Be sure the destination folder is the right location for the predictive metric(s); the resulting predictive metric(s) may be renamed here as well. "Predicted value" is the regression result; "Probability" is the degree of confidence in the estimate.

After clicking "Finish," a save dialog will be presented for the training metric.
Run a training report to create the regression model
The training report will retrieve the independent variables from the database and analyze them to create a regression model to save into the predictive metric. Once the training report is created, it may be run periodically to update the regression model, taking new data into account.
The training report should include:
In this example, only Revenue (the dependent variable) and the training metric were included on the template. The independent variable metrics include the outer join in their definition, so it was not necessary to add them to the template and specify an outer join in Report Data Options.

After running the training report, the following message may be displayed indicating the successful creation of a regression model. The report grid allows you to preview the regression results. If they are not satisfactory, the training metric may be edited to refine the analysis. Rerunning the training report will then update the model in the predictive metric.

Errors encountered at this stage are often the result of unexpected values in the independent variables. Check the DSSErrors.log file on the Strategy Intelligence Server machine (if running the training report in a three-tier connection) or on the Strategy Desktop machine (if two-tier) for messages from the data mining component, identified by in the log.
Use the predictive metric in reports
Once the regression model is sufficiently refined, it may be used in production reports. Be aware of the following:
Plotting the revenue predictor against the original revenue metric on a graph shows that the fit is fairly close, adding confidence to the projected values for 2008.

Further Reading
Strategy Advanced Reporting Guide, Chapter 12: Data Mining Services
Article Reference Number:
KB17762
