EducationSoftwareStrategy.com
StrategyCommunity

Knowledge Base

Product

Community

Knowledge Base

TopicsBrowse ArticlesDeveloper Zone

Product

Download SoftwareProduct DocumentationSecurity Hub

Education

Tutorial VideosSolution GalleryEducation courses

Community

GuidelinesGrandmastersEvents
x_social-icon_white.svglinkedin_social-icon_white.svg
Strategy logoCommunity

© Strategy Inc. All Rights Reserved.

LegalTerms of UsePrivacy Policy
  1. Home
  2. Topics

KB18227: Bar graph displays on the positive axis when all the metric values are negative in MicroStrategy Developer 9.x and 10.x


Stefan Zepeda

Salesforce Solutions Architect • Strategy


Bar graph displays on the positive axis when all the metric values are negative in MicroStrategy Developer 9.x and 10.x

SYMPTOM:
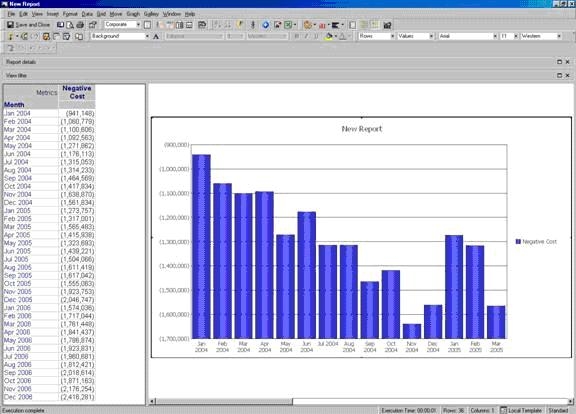
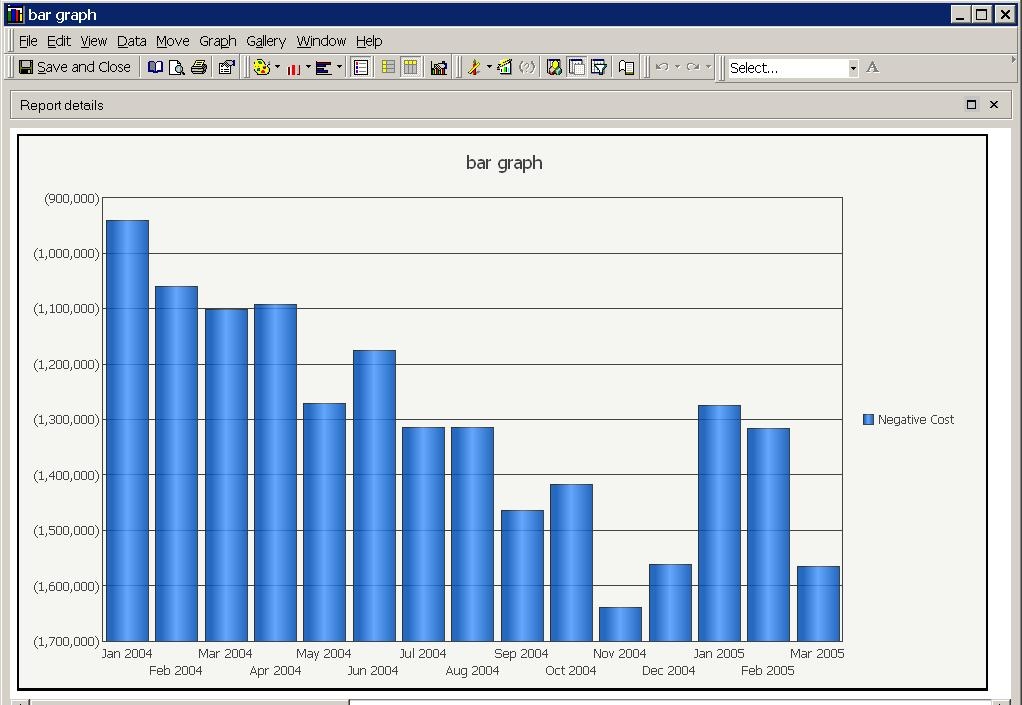
A report is run as a clustered bar graph in Strategy Developer 9.x and 10.x. The bars display on the positive axis although the values are negative, as shown below:
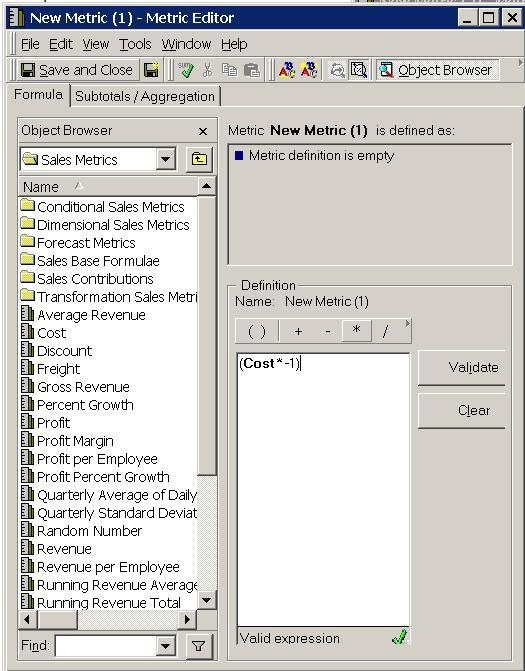
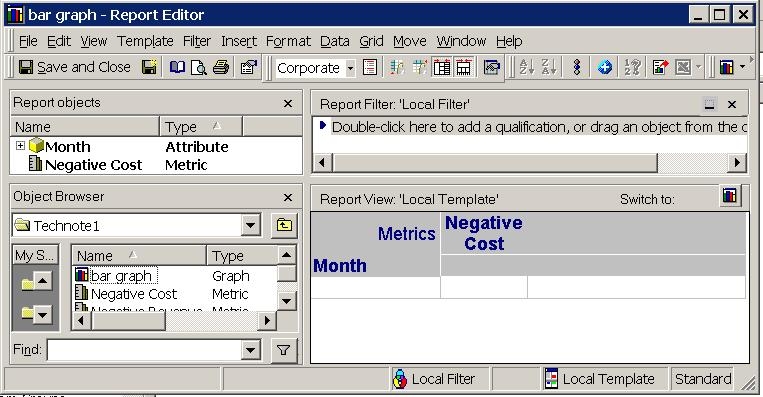
 

ka02R000000kYcaQAE_0EM440000002ErN.jpeg

 
STEPS TO REPRODUCE:
Follow the steps below to reproduce this issue:
 

  • Create one metric that consists only of negative values. The example below is from the Strategy Tutorial project using the Cost metric and multiplying it by -1.
ka02R000000kYcaQAE_0EM440000002Erb.jpeg
  • Add the new metric with one attribute to report. In the example below, the Month attribute was used.
ka02R000000kYcaQAE_0EM440000002ErT.jpeg
  • Run this as a Clustered Bar Graph. The results will appear with 0 at the first value of the graph as shown below:
ka02R000000kYcaQAE_0EM440000002Erh.jpeg

CAUSE:
This is a known issue in Strategy Developer 9.x and 10.x.
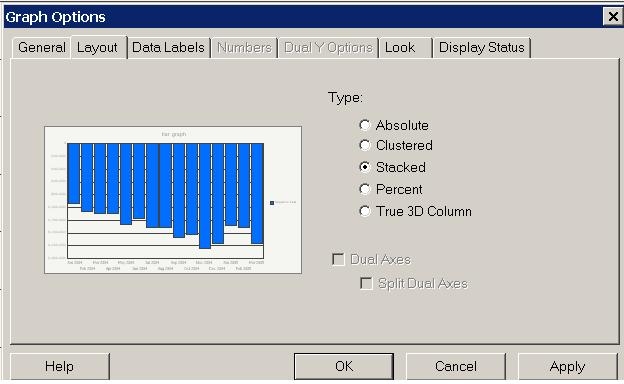
 
ACTION:
Change the bar graph type to Stacked. To do this, right click the graph and select 'Graph Options'. Select the Layout tab and choose 'Stacked' as shown below.
 

ka02R000000kYcaQAE_0EM440000002Erg.jpeg


Comment

0 comments

Details

Knowledge Article

Published:

June 6, 2017

Last Updated:

June 6, 2017