EducationSoftwareStrategy.com
StrategyCommunity

Knowledge Base

Product

Community

Knowledge Base

TopicsBrowse ArticlesDeveloper Zone

Product

Download SoftwareProduct DocumentationSecurity Hub

Education

Tutorial VideosSolution GalleryEducation courses

Community

GuidelinesGrandmastersEvents
x_social-icon_white.svglinkedin_social-icon_white.svg
Strategy logoCommunity

© Strategy Inc. All Rights Reserved.

LegalTerms of UsePrivacy Policy
  1. Home
  2. Topics

KB18402: Compound metric values not correctly aggregated in an OLAP report in MicroStrategy Developer


Stefan Zepeda

Salesforce Solutions Architect • Strategy


This article outlines a known issue whereby in some scenarios dynamic aggregation cannot be correctly performed in MicroStrategy OLAP Services.

SYMPTOM:
Consider the following scenario where a metric (defined as a combination of several facts) has to be expressed as a percentage of increase with regards to the same values for a previous period of time. The result of this calculation needs to be inserted in an OLAP report, typically to be later used as a dataset, which is part of a Report Services document.
 
As long as all attributes in the report are displayed in the template, the metric values are correctly displayed. However, if one of the attributes is placed into the Report Objects window (in other words, taking advantage of the OLAP Services functionality), the metric values are replaced by cross-tabulation or aggregation null values, depending on the metric definition in Strategy Developer.
 
STEPS TO REPRODUCE:
Follow the steps below to reproduce the issue in the Strategy Tutorial project:

  • Create a metric defined as the sum (or any other arithmetic combination of operations) of several facts. In the following steps, a base formula has been created for reusability purposes, but the results are the same if each metric is defined independently. In this example, the 'Revenue' and 'Gross Revenue2' facts have been used to create the base formula 'Revenue_base', as shown below:
ka02R000000kbckQAA_0EM440000002Erw.jpeg
  • Create two metrics using this base formula, adding a transformation to the second metric, as shown below:
ka02R000000kbckQAA_0EM440000002Ery.jpeg
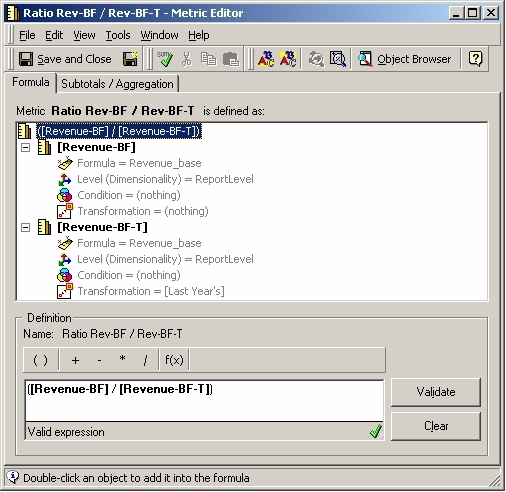
  • Create a compound metric defined as the division of the two metrics created previously, and configure it to be a smart metric, leaving the 'Dynamic aggregation function' as 'Default' as shown below:
ka02R000000kbckQAA_0EM440000002Es1.jpeg
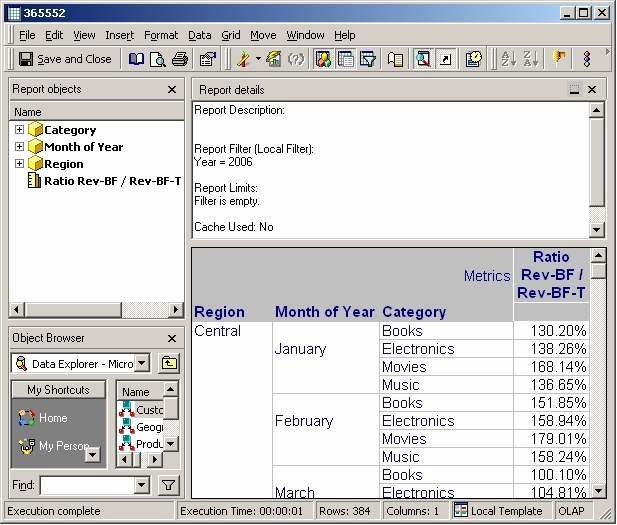
  • Create a report with the attributes Region, Month of the Year, and Category and the compound metric created before. Add a filter for a given year (2006 in this example):
ka02R000000kbckQAA_0EM440000002Ert.jpeg
  • Drag the Category attribute from the report results area to the Report Objects window (OLAP Services functionality). The metric does not perform correctly the dynamic aggregation to the Month level, generating cross-tabulation null values (if the smart metric option is unchecked, the report returns aggregation null values):
ka02R000000kbckQAA_0EM440000002Erv.jpeg

Note: If the base formula definition contains only one aggregated fact, the problem does not occur, as shown below:

ka02R000000kbckQAA_0EM440000002Es2.jpeg

CAUSE:
The cause of this issue is currently under investigation.
 
ACTION:
Contact Strategy Technical Support for an update on this issue.
 
WORKAROUND:
Edit the compound metric. Uncheck the 'Allow Smart Metric' option and manually set the 'Dynamic aggregation function' to the function needed in each case (Average in this example) as shown below:

ka02R000000kbckQAA_0EM440000002Es6.jpeg


Comment

0 comments

Details

Knowledge Article

Published:

June 13, 2017

Last Updated:

June 13, 2017