EducationSoftwareStrategy.com
StrategyCommunity

Knowledge Base

Product

Community

Knowledge Base

TopicsBrowse ArticlesDeveloper Zone

Product

Download SoftwareProduct DocumentationSecurity Hub

Education

Tutorial VideosSolution GalleryEducation courses

Community

GuidelinesGrandmastersEvents
x_social-icon_white.svglinkedin_social-icon_white.svg
Strategy logoCommunity

© Strategy Inc. All Rights Reserved.

LegalTerms of UsePrivacy Policy
  1. Home
  2. Topics

KB18607: Graph’s tooltips do not keep the number format defined in the report in Microstrategy Web 9.x


Community Admin

• Strategy


Graph’s tooltips do not keep the number format defined in the report in MicroStrategy Web 9.x

SYMPTOM:
Tooltips do not keep the number format defined for the data when executing a graph report in Strategy Web 9.x
 
STEPS TO REPRODUCE:
Follow the steps below to reproduce this issue in the Strategy Tutorial project:
 

  • Create a graph report in Strategy Desktop 9.x using the Combination: Dual Axis Bar Line style.
  • Define one of the metrics as a percentage, as shown below:
ka04W000000OfVvQAK_0EM4400000028aQ.jpeg
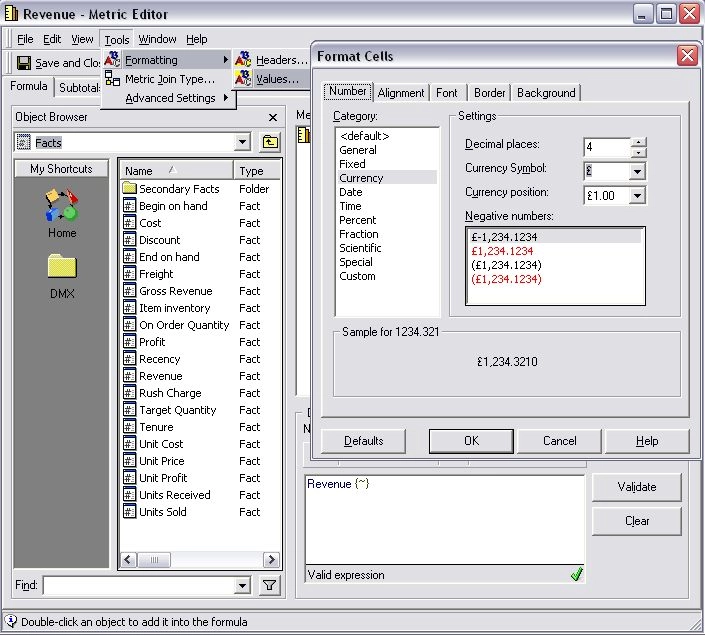
  • Format the metric values in the metric editor to display two decimal places, as shown below:
ka04W000000OfVvQAK_0EM4400000028aT.jpeg
  • Execute the graph in Strategy Web 9.x and move over the graph.
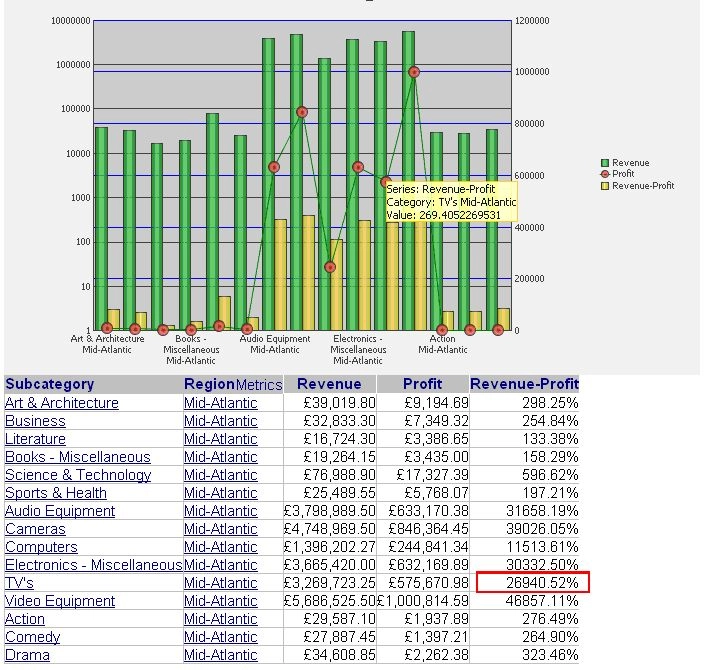
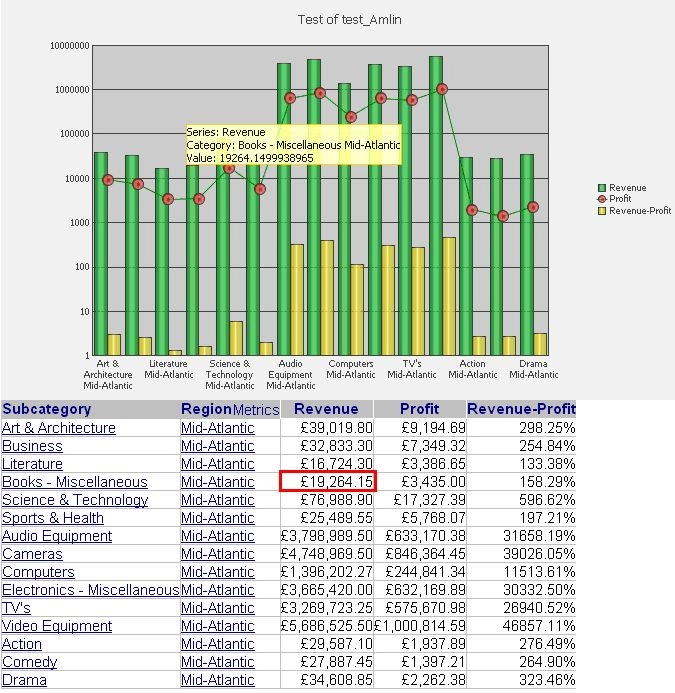
    The tooltips show 8 decimal places instead of the 2 that were defined previously, as shown below:
     
ka04W000000OfVvQAK_0EM4400000028aR.jpeg
ka04W000000OfVvQAK_0EM440000002Hfl.jpeg

CAUSE:
Modify the format from Graph Options available through Desktop. For detailed steps, refer to this archived TN:
 
KB15803: How to modify graph tooltip display in DHTML or Flash Mode for Report Services documents and Dashboards in Strategy Web 9.x  


Comment

0 comments

Details

Knowledge Article

Published:

March 31, 2017

Last Updated:

March 31, 2017