EducationSoftwareStrategy.com
StrategyCommunity

Knowledge Base

Product

Community

Knowledge Base

TopicsBrowse ArticlesDeveloper Zone

Product

Download SoftwareProduct DocumentationSecurity Hub

Education

Tutorial VideosSolution GalleryEducation courses

Community

GuidelinesGrandmastersEvents
x_social-icon_white.svglinkedin_social-icon_white.svg
Strategy logoCommunity

© Strategy Inc. All Rights Reserved.

LegalTerms of UsePrivacy Policy
  1. Home
  2. Topics

KB18910: NMicroStrategy Integrity Manager feature: Highlight Individual Graph Differences


Community Admin

• Strategy


Article outlines how the feature Highlight Individual Graph Differences works in MicroStrategy Integrity Manager

Strategy Integrity Manager can now perform a pixel-by-pixel comparison of two graph images. If any pixels are different in the base and target graph, the graph is considered "not matched".
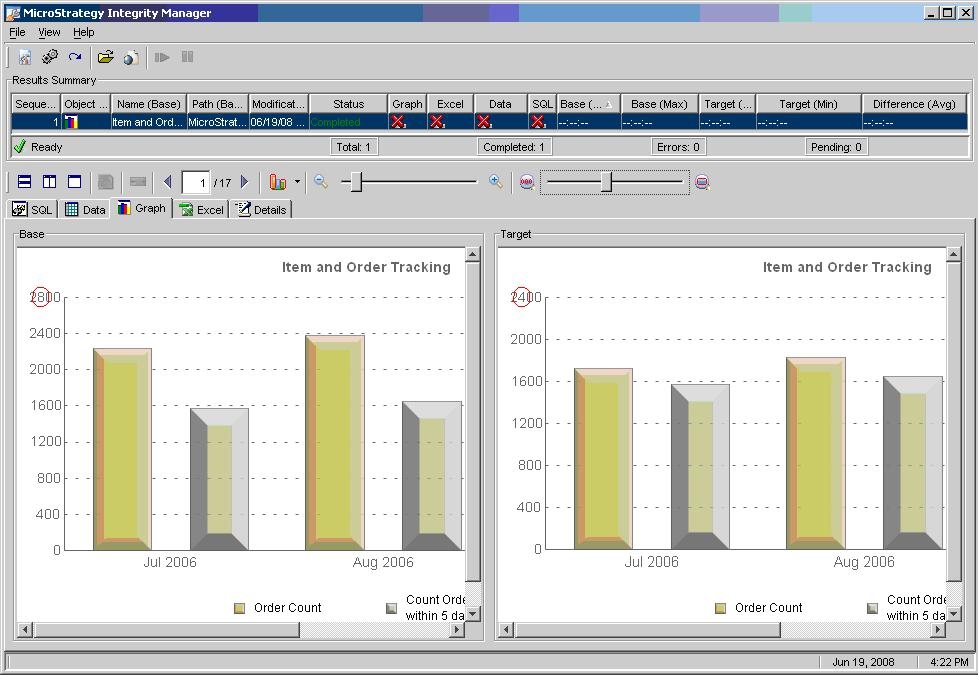
When users view the graph reports, Strategy Integrity Manager draws a red boundary around the currently selected difference as shown below:
 

ka04W000000OeM6QAK_0EM440000002EpS.jpeg

 
To compare graphs, follow the steps below:
 

  1. Run a project-versus-project integrity test. 
  • Alternately, if a baseline has been created previously, a baseline-versus-project integrity test may be used too.
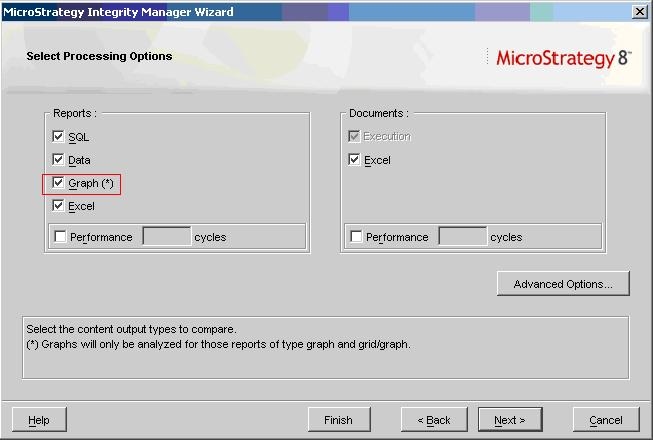
  • When the Select Processing Options of the Integrity Manager Wizard appears, make sure that the Graph option is selected, as shown below:
ka04W000000OeM6QAK_0EM440000002Eph.jpeg
  • Continue through the Wizard and run the test.
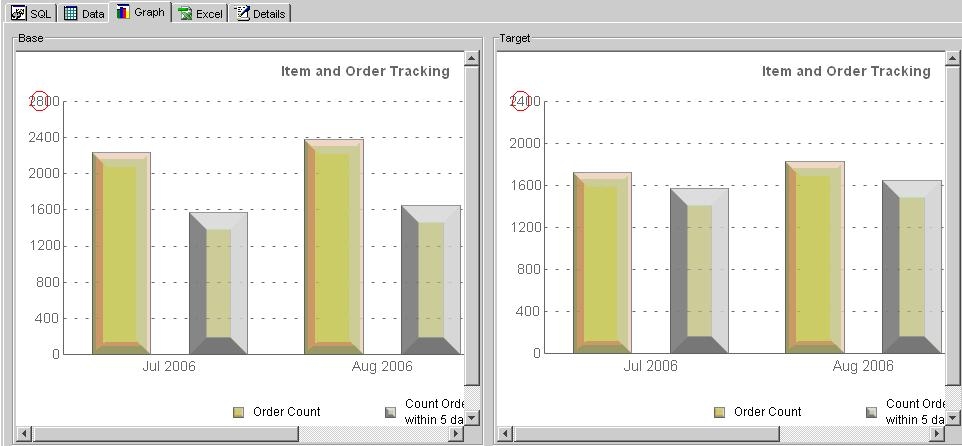
  • To view the differences between the two graphs once the test has been completed, select the Graph Tab as shown below:
ka04W000000OeM6QAK_0EM440000002Epg.jpeg
  • Notice that the differences between the graphs are circled in red. In this example, there are 17 differences. Select the arrow next to the '17' to view the next difference as shown in the next image:
ka04W000000OeM6QAK_0EM440000002EpV.jpeg
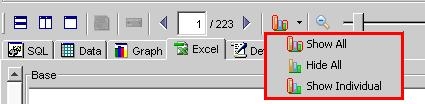
  • To circle all the differences at once, click the Show/Hide differences icon on the Report Data toolbar. To turn off all the circles, click the Show/Hide differences icon again, as shown below:
ka04W000000OeM6QAK_0EM440000002EpF.jpeg
  • The graph can also be zoomed in and out to magnify the differences, as shown below:

Comment

0 comments

Details

Knowledge Article

Published:

June 12, 2017

Last Updated:

June 12, 2017