EducationSoftwareStrategy.com
StrategyCommunity

Knowledge Base

Product

Community

Knowledge Base

TopicsBrowse ArticlesDeveloper Zone

Product

Download SoftwareProduct DocumentationSecurity Hub

Education

Tutorial VideosSolution GalleryEducation courses

Community

GuidelinesGrandmastersEvents
x_social-icon_white.svglinkedin_social-icon_white.svg
Strategy logoCommunity

© Strategy Inc. All Rights Reserved.

LegalTerms of UsePrivacy Policy
  1. Home
  2. Topics

KB19519: Tooltips do not display the values of data points for a series for a graph in Interactive mode MicroStrategy Web 9.x.


Community Admin

• Strategy


Tooltips do not display the values of data points for a series for a graph in Interactive mode MicroStrategy Web 9.x.

SYMPTOM:
 
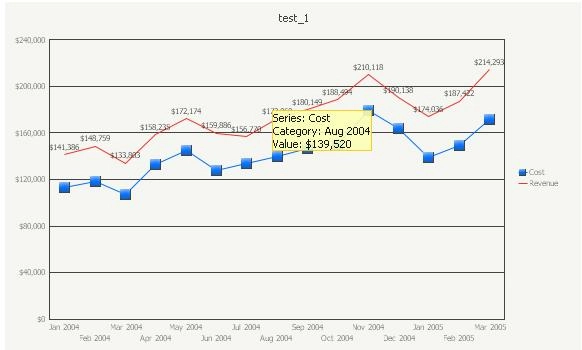
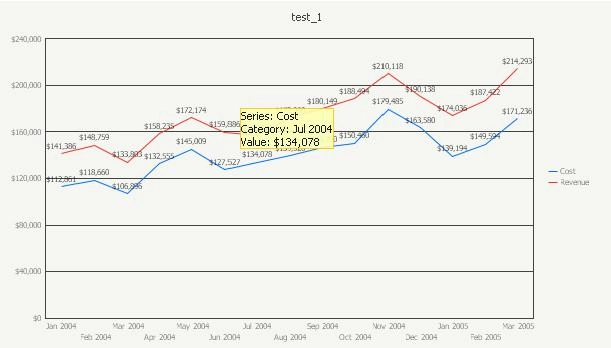
When executing a Report Services Document in Interactive mode in Strategy Web 9.x the Tooltips are not displayed when the pointer is hovering over a series in a line graph. In this example below, the mouse is hovering over the Cost metric series in blue.
 

ka04W000000OfV4QAK_0EM4400000028Um.jpeg

 
CAUSE:
 
This is working as expected. For the tooltip to show the value of a specific point in a series, the Data Labels or the Data markers should be enabled for the series.
 
ACTION:
 
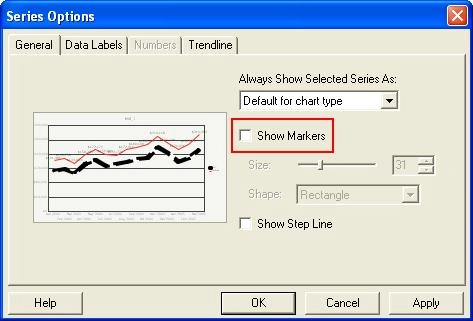
In Strategy Desktop, edit the Graph Report, go to Graph view, select the series, give a right click and select Series Options...
 
Either check the box for 'Show Data Marker' under the General tab:
 

ka04W000000OfV4QAK_0EM4400000028Uq.jpeg


ka04W000000OfV4QAK_0EM440000002Id2.jpeg

 
Or check the box for 'Show the Data Labels' under the Data Labels tab:
 

ka04W000000OfV4QAK_0EM4400000028Uk.jpeg


ka04W000000OfV4QAK_0EM440000002Ics.jpeg


Comment

0 comments

Details

Knowledge Article

Published:

April 7, 2017

Last Updated:

April 7, 2017