This technical note is part of How to troubleshoot Dashboard Performance document that can be found KB19625
The amount of data retrieved and objects being used in a Report Services Dashboard have a direct impact in the size of the final Dashboard. The bigger the Dashboard size the longer it will take to be prepared, be sent to the client, and render.
XML generation:
After the datasets in the Dashboard have been merged, the Intelligence Server generates the necessary XML or binary stream depending on the output selected by the end user.
If the dashboard has been executed for PDF output the Intelligence Server generates the binary stream that will be sent to the client.
For all other outputs, Strategy Office, Strategy Web in DHTML mode and Strategy Web in Flash mode the Intelligence Server generate XML.
The XML generated to transport data and Dashboard formatting information is generated using a tree of nodes, as any other XML file, in order to separate the different sections and pieces of data inside the file.

The highlighted sections are an example of overheads in an XML file (data.xml)
Overheads are the tags and properties inside the XML file, used to create the placeholders necessary to separate the different object's data. Inside the XML the attribute elements inside a drop down need to be separated from the attribute elements displayed inside a grid. This separation is achieved by the use of tags. This tags is what we identify as overheads. Because of the nodes used to differentiate the data pertaining to different objects, certain objects added to a Dashboard, for example selectors, might carry higher overheads affecting the size of the XML file.
In general terms, one can understand that the XML generated contains the data needed to display the dashboard to the end user, structure information and overheads.
XML size = data + structure + overheads
Every time an object is added to a dashboard the size of the XML is increased. Different components have bigger impact on the XML size than others. The following two sections will discuss this impact based on whether the end user requests a Dashboard in DHTML or Flash view mode.
Two important concepts to understand the differences between Flash and DHTML documents are "Current View" and "Slices of Data".
When executing a grid with a page by the displayed data in the grid for the current selection is what we will call "Current View". All the possible views for all the available elements in the page by will be the "Slices of Data"
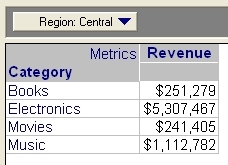
Current View

Slices of data
Common Optimization Techniques for Flash and DHTML dashboards

Certified | Certified | Certified |
Certified | Certified | Certified |
Certified | Certified | Certified |
Certified | Certified | Certified |
Certified | Certified | Certified |
DHTML Dashboards:
When executing a Report Services Dashboard in DHTML view mode the Intelligence Server generates the XML needed to display the Current View to the end user. If the document has a page by or a selector that calculates further slices of the document, when the user changes the selection on those components Strategy Web makes a new request for the new View to the Intelligence Server.
Optimization Techniques:
Flash Documents:
For Flash Documents the Intelligence Server generates the XML necessary to display the Current View and all other Slices of Data present in the Dashboard. XML generation and transport times are increased but responsiveness once the data is on the client is immediate. Flash documents also have the advantage of being more visually appealing and flow smoother between transitions.
The three main components of a Report Services Dashboard in Flash view mode are:
Certified | Certified |
Certified | Certified |
Certified | Certified |
Certified | Certified |
Optimization Techniques