EducationSoftwareStrategy.com
StrategyCommunity

Knowledge Base

Product

Community

Knowledge Base

TopicsBrowse ArticlesDeveloper Zone

Product

Download SoftwareProduct DocumentationSecurity Hub

Education

Tutorial VideosSolution GalleryEducation courses

Community

GuidelinesGrandmastersEvents
x_social-icon_white.svglinkedin_social-icon_white.svg
Strategy logoCommunity

© Strategy Inc. All Rights Reserved.

LegalTerms of UsePrivacy Policy
  1. Home
  2. Topics

KB20135: When viewing a Dual axis bar graph in a Report Services Document in Interactive Mode, the metrics switch axis after changing a metric selector in MicroStrategy Web


Benjamin Reyes

Vice President, Product Management • MicroStrategy


This article notes a behavior with dual axis graphs

Description 

When using a metric selector targeting a Dual Axis Bar Graph, users notice that the metrics may switch axis' after modifying the metric selector in a Report Services Document.
 

Steps to reproduce 

Follow the steps below to reproduce this issue in Strategy Tutorial:
 

  • Create a new Vertical Bar Graph: Dual Axis Clustered with the Year attribute in the rows and the metrics Profit, Revenue and Random Number in the columns.
  • In Developer, select the Graph menu, Graph Options and switch to the 'Dual Y Options' tab. Set the Profit and Revenue metrics to the Y1 axis and the Random Number metric to the Y2 Axis.
  • Save this report and add it with formatting to a new Report Services Document using the Blank Dashboard template.
  • Create a selector on metrics, targeting the graph in step 3.
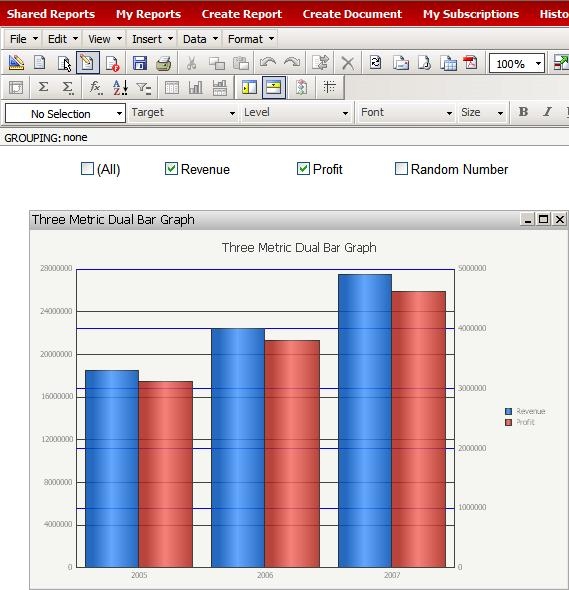
  • Run this to Interactive mode and notice that all three metrics appear with Revenue and Profit on the Y1 axis and Random Number on the Y2 Axis.
ka02R000000g2jMQAQ_0EM440000002Ef2.jpeg
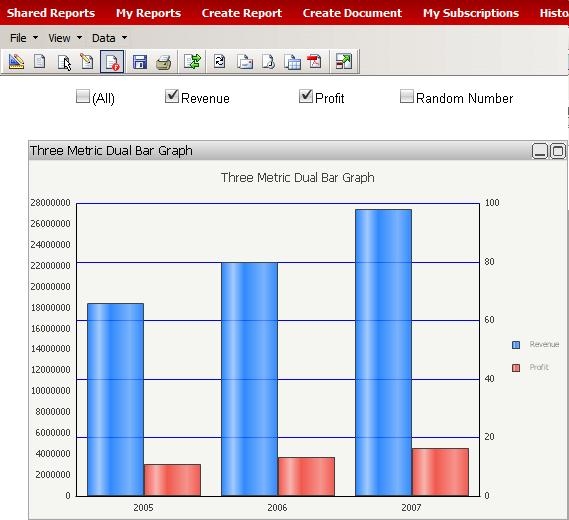
  • De-select the metric checkbox for Random Number. You will see that one metric, is now on the Y1 axis and the other has switched to the Y2 axis.
ka02R000000g2jMQAQ_0EM440000002Ef4.jpeg


Solution 

This is working as designed. Dual axis graphs require at least one metric be present on each axis and control which metrics display on each axis by order. This order is changed based on the selection in the selector.
 

Option 1:

Run the Report Services Document in Flash Mode so it correctly retains the axis selection for both the Revenue and Profit metrics on the Y1 axis.
 

ka02R000000g2jMQAQ_0EM440000002Ef8.jpeg


Learning Resources


Review the Document Creation guide to learn more.


Comment

0 comments

Details

Knowledge Article

Published:

June 13, 2017

Last Updated:

September 16, 2019