EducationSoftwareStrategy.com
StrategyCommunity

Knowledge Base

Product

Community

Knowledge Base

TopicsBrowse ArticlesDeveloper Zone

Product

Download SoftwareProduct DocumentationSecurity Hub

Education

Tutorial VideosSolution GalleryEducation courses

Community

GuidelinesGrandmastersEvents
x_social-icon_white.svglinkedin_social-icon_white.svg
Strategy logoCommunity

© Strategy Inc. All Rights Reserved.

LegalTerms of UsePrivacy Policy
  1. Home
  2. Topics

KB203366: How to use metrics as selector in a pie chart in Report Services document in MicroStrategy Web 9.4.1


Community Admin

• Strategy


How-to-use-metrics-as-selector-in-a-pie-chart-in-Report

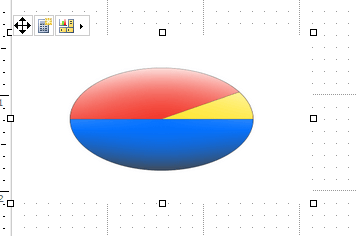
In a pie chart containing only two metrics, user wants to click on one metric and the bar graph will return the top 10 customer based on that metric.

ka04W000000OglxQAC_0EM4400000025yx.jpeg

ACTION:
Follow the steps below to implement the above feature in  in Strategy Web 9.4.1:
1. Create a dataset report.

ka04W000000OglxQAC_0EM4400000025z9.jpeg

2.Create a document. Add a grid with Profit and Cost in rows.

ka04W000000OglxQAC_0EM4400000025yt.jpeg

3.Create separate graphs for customer*profit and customer*cost

ka04W000000OglxQAC_0EM4400000025zB.jpeg

4. Apply view filter accordingly

ka04W000000OglxQAC_0EM4400000025z7.jpeg
ka04W000000OglxQAC_0EM4400000025z2.jpeg

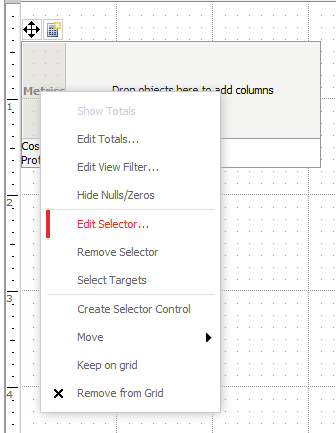
5. Configure Metric in the first grid as selector targeting at two graphs.
ka04W000000OglxQAC_0EM4400000025z1.jpeg
ka04W000000OglxQAC_0EM4400000025zD.jpeg

6. Configure the grid as pie chart.

ka04W000000OglxQAC_0EM4400000025z4.jpeg

7. Change pie chart setting to "Series by Row" (in Editable mode, Click graph, on the toolbar choose "Series by Row")

ka04W000000OglxQAC_0EM4400000025yr.jpeg

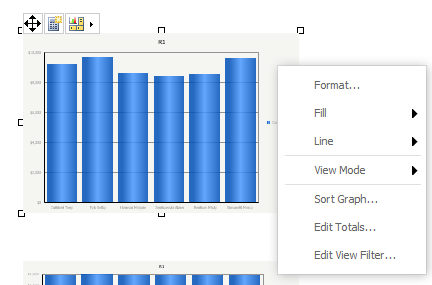
8. Change the two bar graphs format: Maximum Categories=10
ka04W000000OglxQAC_0EM4400000025yn.jpeg
ka04W000000OglxQAC_0EM4400000025yd.jpeg

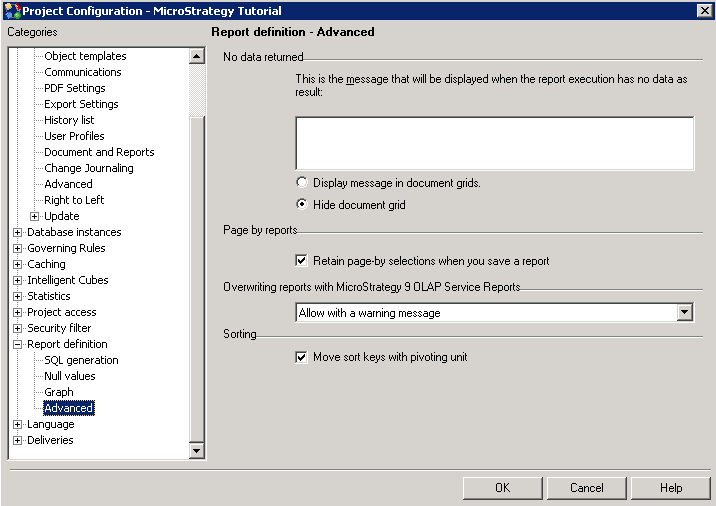
9. Now go to developer, project configuration--report definition--advanced--no data returned, change to hide document grid.
ka04W000000OglxQAC_0EM4400000025z0.jpeg

10. Restart IIS (This is important for step 9 to take effect)
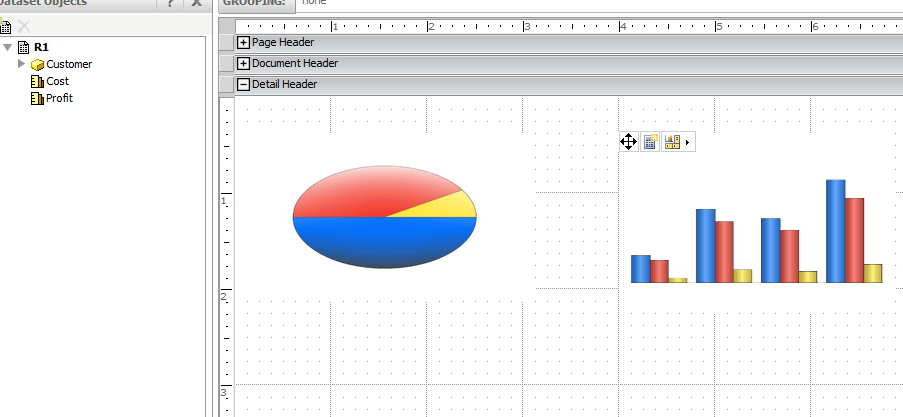
11. Put the two bar graphs together in same position as if they are same graph.
ka04W000000OglxQAC_0EM4400000025z5.jpeg

In editable mode, click on cost:

ka04W000000OglxQAC_0EM4400000025yc.jpeg

Click on profit:

ka04W000000OglxQAC_0EM4400000025yp.jpeg

Comment

0 comments

Details

Knowledge Article

Published:

June 9, 2017

Last Updated:

June 9, 2017