EducationSoftwareStrategy.com
StrategyCommunity

Knowledge Base

Product

Community

Knowledge Base

TopicsBrowse ArticlesDeveloper Zone

Product

Download SoftwareProduct DocumentationSecurity Hub

Education

Tutorial VideosSolution GalleryEducation courses

Community

GuidelinesGrandmastersEvents
x_social-icon_white.svglinkedin_social-icon_white.svg
Strategy logoCommunity

© Strategy Inc. All Rights Reserved.

LegalTerms of UsePrivacy Policy
  1. Home
  2. Topics

KB210392: How to plot United States Counties in an ESRI Map with areas in a cloud configuration


Community Admin

• Strategy


Starting in version 9.4.1 HF6 MicroStrategy supports the plotting of geoattributes as areas in an ESRI Map with Areas visualization or widget. Unites States counties cannot be uniquely identified by their name because they can be repeated across different states.

Summary

Starting in version 9.4.1 HF6 Strategy supports the plotting of geoattributes as areas in an ESRI Map with Areas visualization or widget. Unites States counties cannot be uniquely identified by their name because they can be repeated across different states. To correctly configure the Strategy environment to plot United States counties follow the procedure below.
 

Prepare the County and State data

There are two ways to make County and State data available to the Strategy mapping engine. Identify the data feeding source below and follow the technote to prepare the data for mapping purposes:

  • Data Import refer to KB210396 How to use Data Import to prepare a dataset to plot United States Counties in an ESRI Map with areas in MicroStrategy Web 9.4.1 HF6
  • Warehouse Data refer to KB210768 How to prepare the MicroStrategy schema to plot United States Counties in an ESRI Map with areas in MicroStrategy Web 9.4.1 HF6

Once the procedure above has been followed, identify the mapping resource that will be used to present data to the user. Notice that this Technical Note only covers a Cloud Map configuration, therefore, only flash mode documents and Visual Insight Dashboards are available. 
 

Mapping United States Counties in a Report Services Document Flash Mode or Presentation Mode

  • Create a new document based on a dataset that contains the data prepared above, as well as any metrics that wish to be used. 
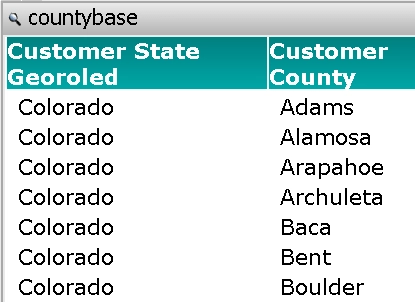
  • Insert a new grid with at least County and State information in the new document. Both attributes should only show the name attribute form. The grid should be similar to the one below for the state of Colorado:
ka04W00000148nDQAQ_0EM4400000025vM.jpeg
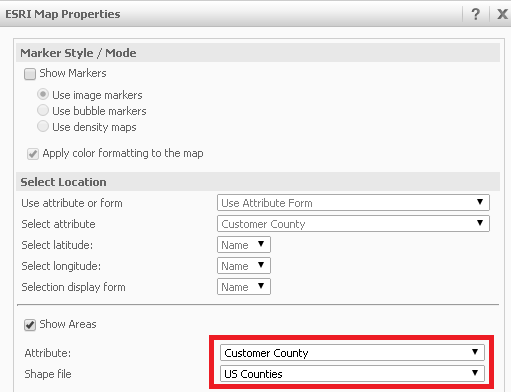
  • Configure the grid as an ESRI Map Widget as shown below:
ka04W00000148nDQAQ_0EM4400000025vV.jpeg
  • Select the ESRI Properties to plot Areas and to use the US Counties Shape file as shown in the image above.
     
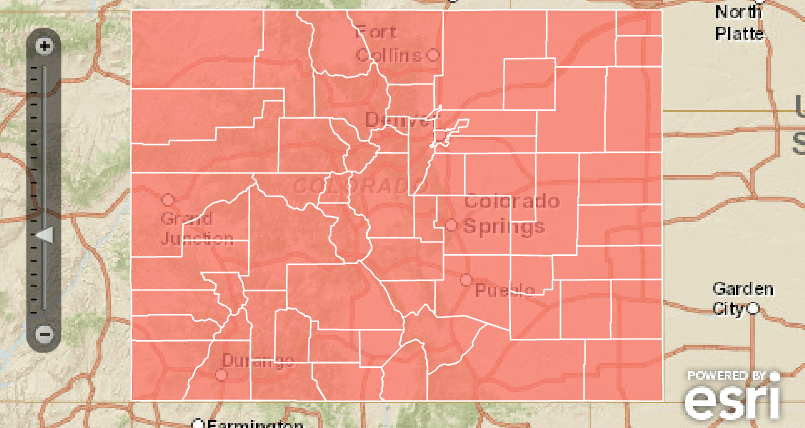
  • Execute in Flash Mode. In the example below, a filter was applied to only show the counties of Colorado:
ka04W00000148nDQAQ_0EM4400000025vP.jpeg


Mapping United States Counties in a Visual Insight Dashboard

  • Create a new Visual Insight Dashboard based on a dataset that contains the data prepared above, as well as any metrics that wish to be used. 
  • Select a the visualization of type Map with Areas
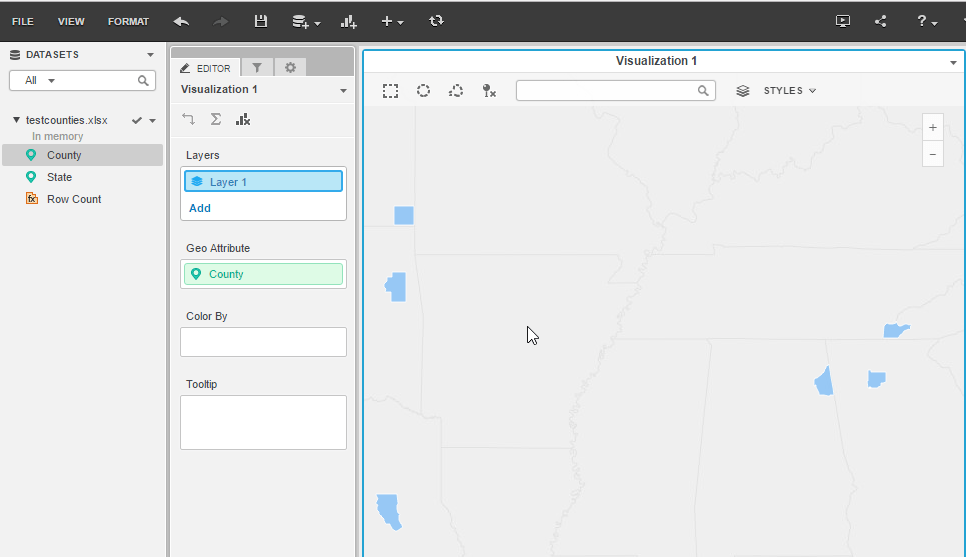
  • In the Geo Attribute dropzone insert the attribute that contains County information.
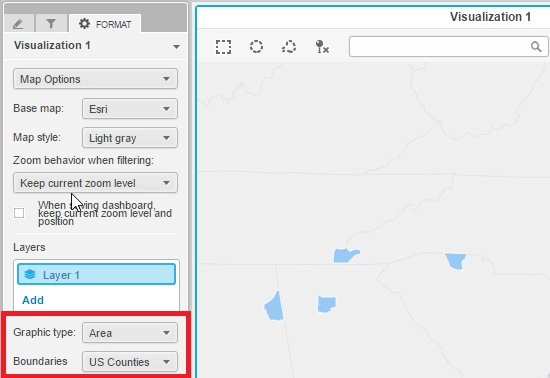
  • In the properties for the Visualization, make sure that US Counties is selected as shown below:
ka04W00000148nDQAQ_0EM440000002JLw.png
  • In the Tooltip dropzone insert the attribute that contains the State information. In the example below, a filter was applied to only show information for Hawaii:
ka04W00000148nDQAQ_0EM440000002JM1.png


KB210392


Comment

0 comments

Details

Knowledge Article

Published:

April 12, 2017

Last Updated:

November 23, 2018