SYMPTOM:
Users have the ability to create different graph types in the form of visualizations in Visual Insight in Strategy Web 9.4.1. For bar graphs with data that cannot fit in the width of the visualization, a scroll bar is automatically generated to allow the user to horizontally scroll to see all of the data. When scrolling to the right, horizontal grid lines will not be drawn entirely, as shown in the image below.
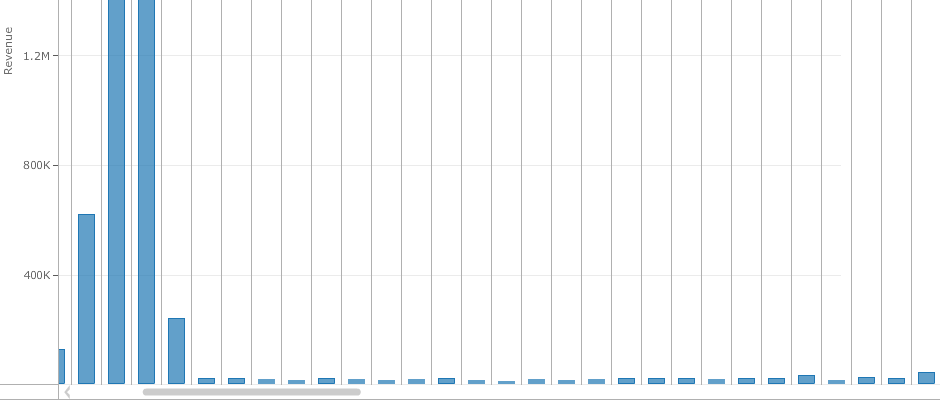
Notice how the lines corresponding to 1.2M, 800k, and 400k are all cut-off on the right side of the graph before the last 3 bars.
STEPS TO REPRODUCE:
CAUSE:
This is a known issue in Strategy Web 9.4.1.
ACTION:
This issue has been addressed in Strategy 10.x. Upgrade to take advantage of this fix.
The Strategy Internal Reference Number for the issue discussed in this technical note is 919863.
