SUMMARY:
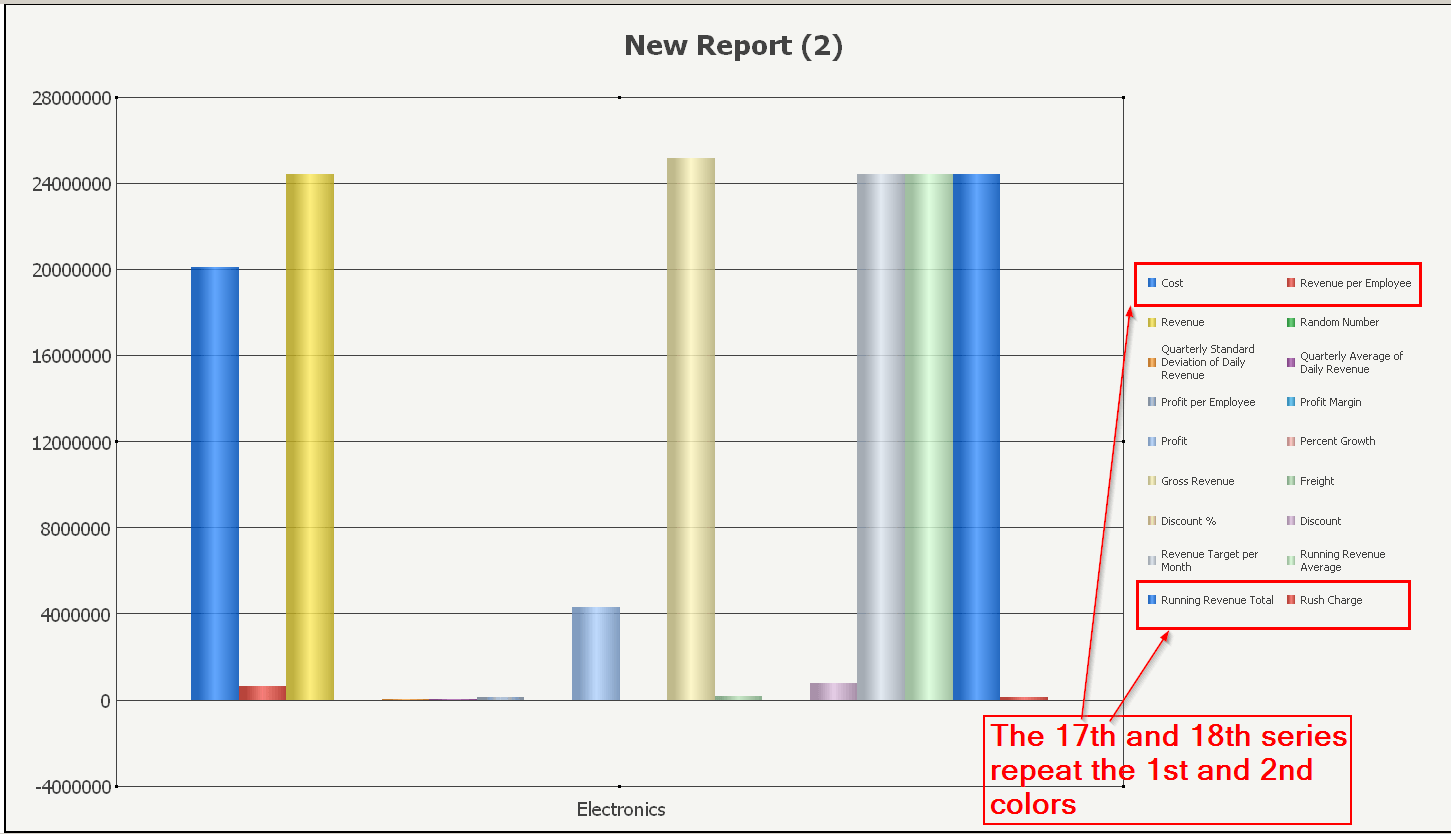
When editing a graph in Developer, the Color menu in the Graph Preferences window shows 16 slots where colors can be defined. In this interface, a user can only specify 16 different colors to apply to series on the graph. When more than 16 series are present, colors displayed on the graph begin to repeat starting from the first color in the Color menu.
SYMPTOM:
In a graph in Developer, a user only sees 16 slots for different colors to be specified when they enter the Preferences menu and select Colors. This menu does not allow a user to increase the number of colors they can specify, so if they would like more than 16 custom colors this cannot be done by defining a color scheme. The following screenshot shows the Color menu interface:
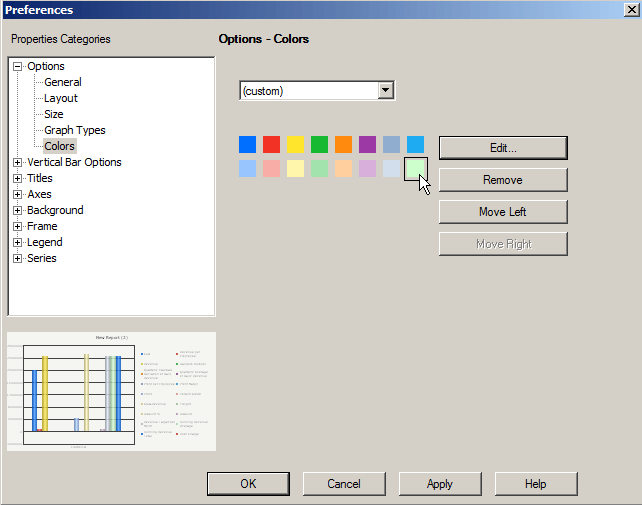
If all 16 colors are assigned and there are more than 16 series, by default the color sequence will repeat starting at the 17th series (17th takes the first custom color, 18th the second, etc.).
CAUSE:
This is working as designed in Strategy 9.4.x. This is a limitation of the Color menu in the Graph Preferences interface in Strategy Developer 9.4.x.
ACTION:
An enhancement request to increase the amount of color slots available in the graph options has been logged. Currently this issue is still being reviewed for feasibility by our Technology team and it is not scoped for any upcoming scheduled Strategy release.
WORKAROUND:
There are a few workarounds that may be used to create graphs with more than 16 custom colors. The first option is to assign colors to the individual series on the graph. This will override the color scheme chosen in the Graph Options colors menu. Within the Graph Options window, select "Series" and a list of all the series on the graph will be displayed. Expand one of these series and select "Fill".
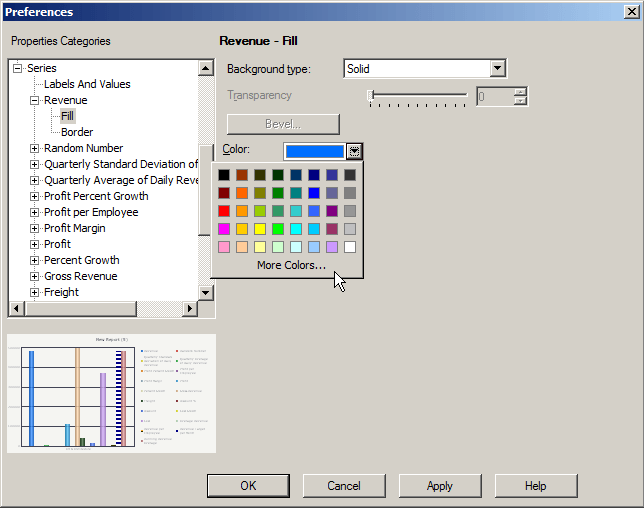
A color can be chosen here for the series.
An alternative workaround is to assign metrics specific colors to display on graphs. In the metric editor, select Tools-->Formatting-->Headers.

Choose the "Chart" tab and assign a series color.

This color will apply to the metric any time it is used on a graph, and overrides any colors specified in the graph options. This option only works for metrics, as attribute elements cannot be individually assigned colors.
The Strategy Internal Reference Number for the issue discussed in this Technical Note is 996733.
